"

1. Creat points

1. Create your Lab 4 workspace, e.g., Lab04, and add a scanned map, “scan_2024_0916_15_0618_ref.tif.

2. Click Raster Layer on the Ribbon, and adjust the scanned map’s Transparency to 50%

We will create a “Point” vector layer from the scanned map first.

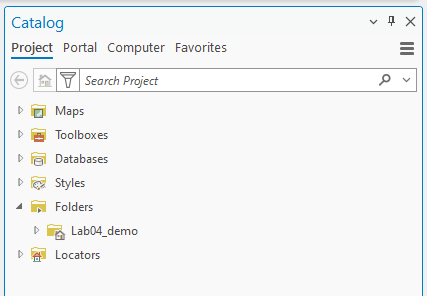
3. In the Catalog pane, expand Folders and find your Lab04 folder:

Screenshot of the Catalog pane in a software application. The Project tab is selected among tabs labeled Project, Portal, Computer, and Favorites. A search bar labeled 'Search Project' is visible below the tabs. The pane displays expandable folders including Maps, Toolboxes, Databases, Styles, Folders (expanded to show Lab04_demo), and Locators.
Catalog window in a software application showing organized project elements such as Maps, Toolboxes, Databases, Styles, Folders (including Lab04_demo), and Locators under the Project tab.

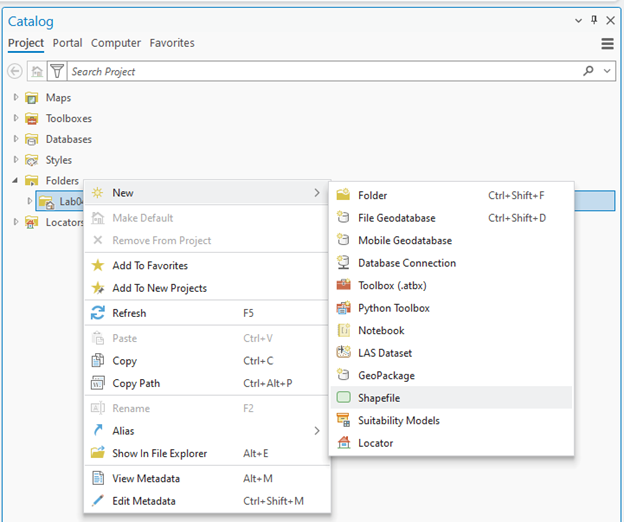
4. Right-click the Lab04 workspace folder, click New, and choose Shapefile:

Screenshot of the Catalog pane in ArcGIS Pro software. The pane displays a hierarchical list of project elements including Maps, Toolboxes, Databases, Styles, Folders, and Locators. A context menu is open under the Folders section, showing options to create new items such as Folder, File Geodatabase, Mobile Geodatabase, Shapefile (highlighted), and others. Additional menu options include actions like Make Default, Add to Favorites, Refresh, Rename, View Metadata, and Edit Metadata.
Creating a new shapefile in the Catalog pane by right-clicking the Lab08 folder and selecting from the context menu in a GIS application.

5. The Create Feature Class tool appears in the Geoprocessing tab. Fill in the parameters, focusing on

    • Feature Class Name: Shipwrecks
    • Geometry Type: Change from default “Polygon” to “Point”
    • Coordinate System: Click the dropdown icon and choose scan_2024_0916_14_0618.tif. Then, “WGS 1984 Web Mercator Auxiliary Sphere” will appear, as it’s the spatial reference of the scanned maps.

6. Click Run. You can find “Shipwrecks” in the Contents pane.

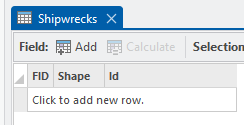
The Shipwrecks point vector is currently an “empty” file since we have not inserted anything in it yet; please open the attribute table of the Shipwrecks layer to confirm its emptiness:

A screenshot of a data table interface titled "Shipwrecks." The toolbar includes buttons labeled "Field," "Add," and "Calculate." The table displays columns named "FID," "Shape," and "Id," with one row prompting "Click to add new row.
Data entry interface for recording shipwreck information, featuring columns for FID, Shape, and Id, with an option to add new entries.

We will use the Edit tool to create a digital format of the shipwreck location in the scanned map.

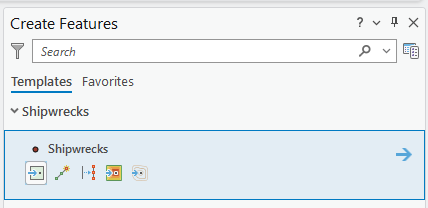
7. On the Edit tab in the Ribbon, click Create. Then click the Shipwrecks in the Create Features tab and choose the Point:

Software interface for creating features, showing a search bar at the top and two tabs labeled "Templates" and "Favorites." Under the "Templates" tab, a category named "Shipwrecks" is expanded to reveal an item also named "Shipwrecks," with icons representing tools or actions related to shipwrecks.
Create the Features menu in GIS software with the Shipwrecks template selected, showing available tools for adding shipwreck-related features.

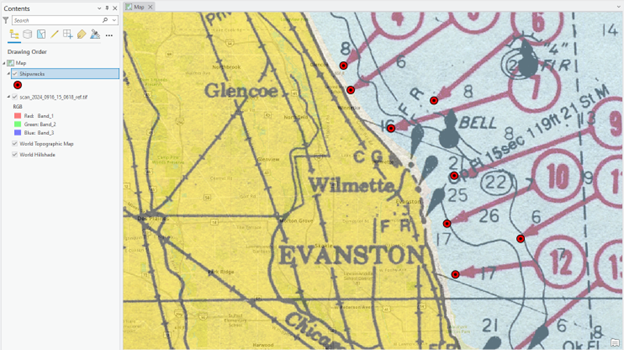
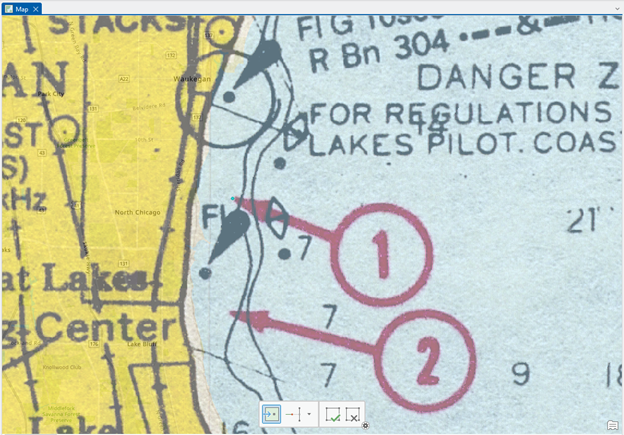
8. Find and click the first shipwreck point. You can find a small “cyan” colored dot at the location that you clicked:

Nautical chart of the Great Lakes near North Chicago, showing land areas in yellow and water areas in blue. The chart includes navigational markers, depth contours, and two red arrows pointing to circled numbers "1" and "2". Land features include labeled areas such as "Great Lakes Center," while water areas contain labels like "DANGER ZONE" and regulatory instructions.
Navigational chart highlighting danger zones and maritime regulations near the Great Lakes Center, with marked points of interest labeled “1” and “2.

8. Click the Save button in the Edit tab occasionally for the digitizing process.

9. Complete digitizing of all the shipwreck points.

10. Change the point symbology to present it as an accident location. You can select any symbol that you want – here is an example:

Map displaying the Illinois shoreline areas of Glencoe, Wilmette, and Evanston. Red dots along the shoreline near Wilmette and Evanston indicate shipwreck locations. The map includes roads, bodies of water, and a left-side panel showing "Shipwrecks" listed under the drawing order.
Detailed map showing shipwreck locations along the Lake Michigan shoreline near Evanston, Wilmette, and Glencoe, Illinois, with visible map layers in the side panel.

License

Intro GIS Labs Copyright © by yurikim. All Rights Reserved.