
1. JOIN a table
The Join tool in ArcGIS links non-spatial data to spatial data through a common field, i.e., Identifier (ID). In this part, we will join the 2012, 2016, 2020, and 2024 general election voter turnout “text” format data to the Indiana county-level census “GIS” layer.
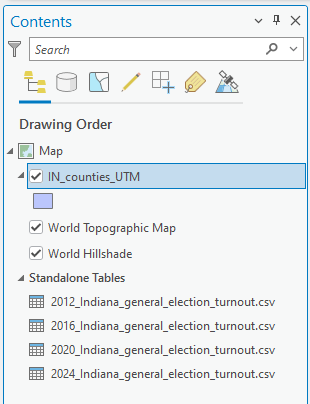
1. Open ArcGIS Pro and add IN_counties_UTM and four CSV files: 2012, 2016, 2020, and 2024. Check the Contents pane – you can find one GIS layer and four Standalone Tables:
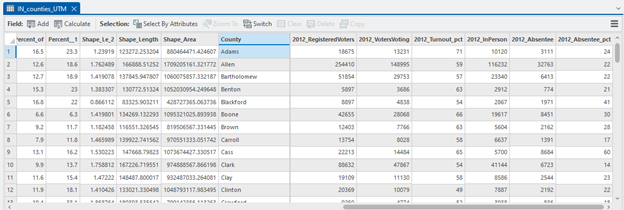
2. Open the attribute table of IN_counties and one of the CSV files.
Stop and Examine: What is the “common” field? In other words, what is the information that appears in both the text file and the GIS feature? If you find the common field, you are ready to process a JOIN!
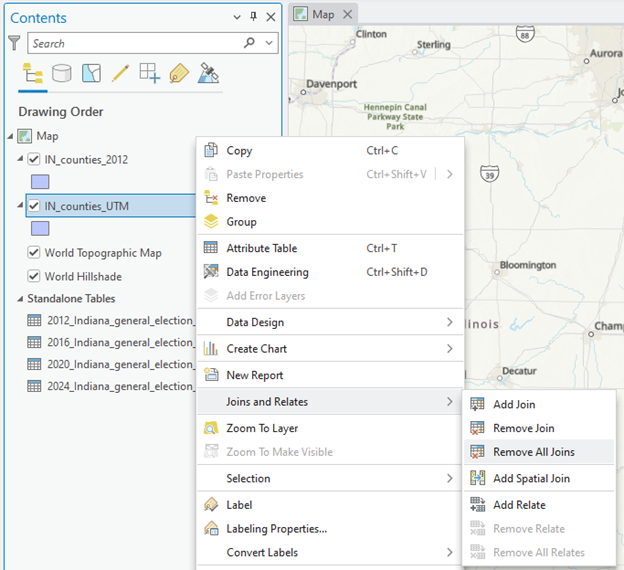
3. Right-click the IN_counties_UTM.shp, find Joins and Relates, and click Add Join. Fill in the parameters like:
-
- Input Table: IN_counties
- Input Join Field: (Your choice!)
- Join Table: 2012_Indiana_general_election_turnout.csv
- Join Table Field: (Your choice!)
4. And confirm that the Keep All Target Features is checked. Click OK.
5. Open the Attribute Table of IN_counties_UTM.shp and scroll to the right to check that the 2012 voting turnout table is properly linked:
Stop and Retry: If the join is unsuccessful, you can see lots of <null> in the attribute table. Then, please remove the current join by right-clicking the IN_counties.shp, finding Joins and Relates, and clicking Remove All Joins. Then, retry the join with the appropriate field.
Note that the Join is a temporary process. Your geospatial analysis with a table-joined GIS layer would not go smoothly, as the original GIS data attribute table simply “links” other tables and does not firmly attach. You need to make the “joined” layer a permanent GIS layer by creating a new layer from it.
6. Right-click the IN_counties_UTM, find Data, and click Export Features—name Output Feature Class as IN_counties_2012.
7. We will REMOVE the current join in the IN_counties before joining another table. Right-click the IN_counties.shp, find Joins and Relates, and click Remove All Joins:
8. Repeat the join process with the other three text format databases, 2016, 2020, and 2024 voter turnout.