2. Create Maps (with sharing legend)
Reemphasis: Our interest in this lab is to present the general election voter turnout percentage of each county in 2012, 2016, 2020, and 2024. What maps would you like to create to compare and contrast the four different years? (Tip: Picturing your expected map before processing the actual map-making always helps to generate efficiently communicable maps!)
The key concepts that we will practice in this section for the deep-diving map-making technique are: Choropleth map, graduated colors, and a consistent legend.
1. Right-click IN_conuties_2012, find Symbology, and change parameters like:
-
- Primary Symbology: Graduated colors
- Field: 2012_Turnout_Percent
- Method: Equal Interval
- Classes: 6
- Color scheme: (your choice of color)
2. Repeat step 1 with three other layers, e.g., IN_counties_2016, IN_counties_2020, and IN_counties_2024.
Stop and Discuss:
- Why is the “Equal Interval” method used in this case?
- Examine the range of voting turnout percentages in each layer in the Contents pane. Are they all identical or not? Do you think what range of turnout percentage values exhaustively includes all the time-series voting turnout patterns of our lab (e.g., 2012, 2016, 2020, and 2024) in Indiana?
- Are there any counties that miss the Voter Turnout percentage? If there are, why and how can the issue be resolved?
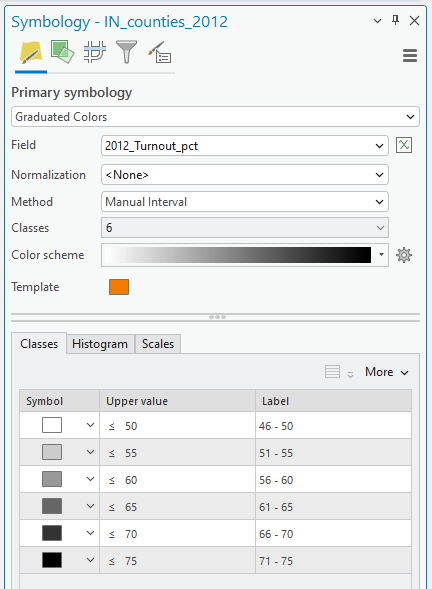
3. Double-check IN_counties_2012 Symbology to Equal Interval data classification method with 6 Classes.
4. Change the classification Method to Manual Interval and type the Upper value, like the figure below:
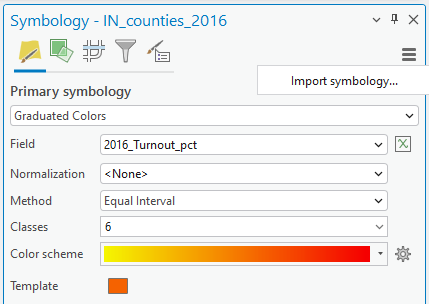
5. We will apply the IN_counties_2012 classification scheme to IN_counties_2016. Open Symbology of IN_counties_2016, click the Import symbology… icon in the upper right corner:
6. In the Apply Symbology from Layer tool, fill in the parameters like below, and click RUN:
-
- Input Layer: IN_counties_2016
- Symbology Layer: IN_counties_2012
- Symbology Fields
- Type: Value field
- Source Field: 2012_ Turnout_Percent
- Target Field: 2016_Turnout_Percent
- Update Symbology Ranges by Data: Maintain ranges
7. Confirm if the IN_counties_2016 has the same data range as IN_counties_2012!
8. Repeat “change symbology” with the 2020 and 2024 voting turnout percentages.
Figure (total 5 pts.): Create a map
Submit ONE MAP FRAME containing the 2012, 2016, 2020, and 2024 voting turnout. Remember to include five map elements, e.g., figure, title, legend, north arrow, and scale bar. (3 pts.)
Reemphasis: ONE legend must fit all four maps. Please clearly provide the value range for each of the six classes in your legend (2 pts.)
Exercises (total 6 pts.): Analyze a map
Describe the patterns of the voter datasets in 2012 – 2024 in Indiana, especially focusing on
- Explain the overall time-series change in the 2012, 2016, 2020, and 2024 maps (1 pt.)
- Explain the overall spatial patterns or clustering in the 2012, 2016, 2020, and 2024 maps. For example, you can focus on a specific year’s spatial pattern (e.g., northern, central, southern, eastern, or western in 2024) or a particular location’s temporal pattern (e.g., Northern regions’ voter turnout percentage change in the 2012, 2016, 2020, and 2024) (1 pt.)
- Choose a county that you want to discuss more deeply. What temporal/spatial patterns did you find? (2 tts.)
- What associations do you see between the data and other factors (e.g., rural vs. urban counties, distance to major urban areas, economic factors, ethnicity, age group, etc.)? Utilize the census data in the IN_counties.shp, and feel free to use other sources to put some thought into this (2 pts.)
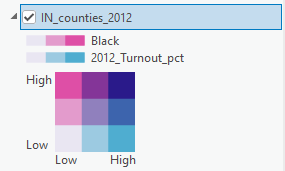
Extra Credits (1 pt.): Bivariate Map
A Bivariate Map in Symbology helps you to examine spatial patterns of the two variables. For example, assume you are interested in the relationship between voting turnout percentage and Black voters in 2012 and 2024. Open IN_counties_2012 Symbology and choose Bivariate Map in Primary Symbology. Repeat it with IN_counties_2020 and compare the local patterns with it: