
3. Work with Attribute Table (1): Calculate statistics &
Our next step is to analyze the overall land use/land cover status in the study area. We have been inspecting the spatial data using visual aids, such as changing symbology and creating maps. Additionally, we will now utilize tools for the attribute table of the spatial data to obtain statistics and calculate fields as percentages.
1. Open the NLCD2024_polygon_Dissolve attribute table (right-click NLCD2024_polygon_Dissolve and click Attribute Table)
2. First, find the total area of Monroe County. Right-click Shape_Area, and click Visualize Statistics
3. Write down the Sum value in the Chart Properties.
Now, let’s calculate the percentage of each LULC class in Moroe County.
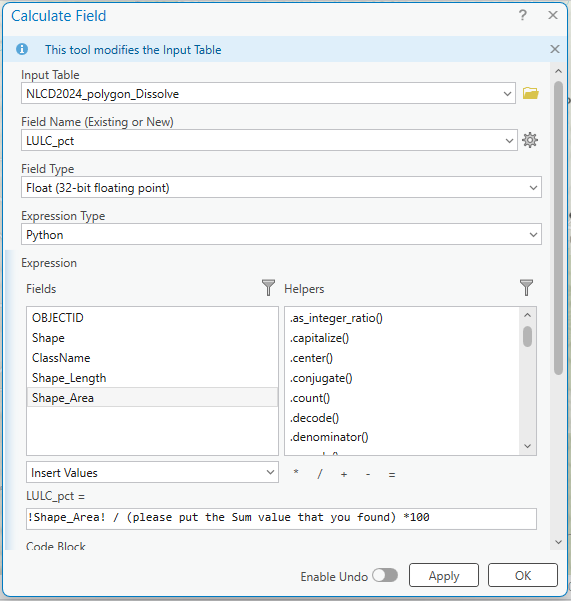
4. Back to the NLCD2024_polygon_Dissolve attribute table, right-click Shape_Area, click Calculate Field, and fill in the parameters like the figure below:
Question 3 (1 pt.)
What are the top FOUR land uses/land cover in Monroe County, and what percentages?