
1. Raster Analysis using Map Algebra
Let’s outline the GIS analysis procedure for this project: identifying the best cities for the solar power market. The preferred cities are supposed to have a high population, receive sufficient solar insolation, and be located on smooth terrain. We will use a raster-based GIS database of variables (e.g., population, solar insolation, cloud-free levels, and elevation), set criteria for each variable to select locations (e.g., how much solar insolation is desirable?), and overlay all selected locations from each raster layer to finalize the potentially marketable cities to expand the solar energy market.
We will create THREE output rasters based on the following:
- Raster 1
- Population density is greater than 50 people/Km2.
- Insolation is greater than 200 Watts/m2.
- The elevation is less than 1524 meters (5000 feet).
- The slope is less than 45 degrees.
- Cloudless hours are greater than 60% of cloud-free hours per year.
- Raster 2
- Population density is greater than 50 people/Km2
- Insolation is greater than 200 Watts/m2
- The elevation is less than 1524 meters (5000 feet).
- The Slope is less than 45 degrees.
- Cloudless hours are greater than 70% of cloud-free hours per year
- Raster 3
- Population density is greater than 50 people/Km2
- Insolation is greater than 200 Watts/m2
- The elevation is less than 1524 meters (5000 feet)
- The Slope is less than 45 degrees.
- Cloudless hours are greater than 75% of cloud-free hours per year
1. Add cloudless, elevation, insolation, and population (from the Lab 9 data folder) to the ArcGIS Pro.
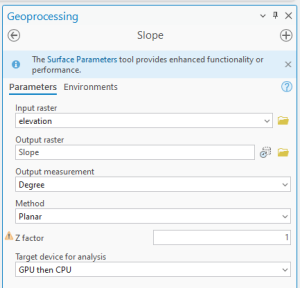
We have prepared all inputs for Raster 1, 2, and 3, but not for the slope. Let’s create a “Slope” layer from the Elevation.
2. Find a Slope tool in the Geoprocessing tab and fill in the parameters like:
All input raster layers are now ready to be processed. First, let’s find the location with a population greater than 50 people/Km2. Open Raster Calculator in the Geoprocessing tab.
3. Uncheck all the layers but population.
4. Double-click population, click on the “>” (i.e., greater than) button; you can also type “>” on your computer keyboard. Then type “50” in the text box after the > sign. Give the output name “pop_gt_50.” Click Run.
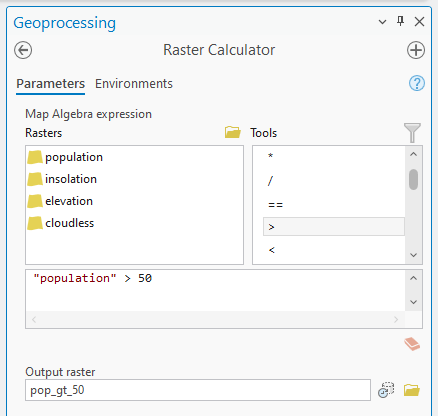
The output raster in the Contents shows all cells with a population density greater than 50 people/km2, with a value of 1 (the expression was True). A cell value of 0 indicates a cell with a population density less than 50 (the expression was False). The 0, 1 format is referred to as a “binary map” — based on the query expression, every raster cell evaluates to either True or False.
Let’s process other rasters: insolation and terrain. Again, we will create THREE output rasters based on the following:
- Raster 1
- Population density is greater than 50 people/Km2.
- Insolation is greater than 200 Watts/m2.
- The elevation is less than 1524 meters (5000 feet).
- The slope is less than 45 degrees.
- Cloudless hours are greater than 60% of cloud-free hours per year.
- Raster 2
- Population density is greater than 50 people/Km2
- Insolation is greater than 200 Watts/m2
- The elevation is less than 1524 meters (5000 feet).
- The Slope is less than 45 degrees.
- Cloudless hours are greater than 70% of cloud-free hours per year
- Raster 3
- Population density is greater than 50 people/Km2
- Insolation is greater than 200 Watts/m2
- The elevation is less than 1524 meters (5000 feet)
- The Slope is less than 45 degrees.
- Cloudless hours are greater than 75% of cloud-free hours per year
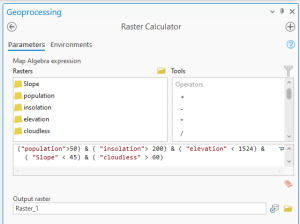
5. We can combine all four layers into a single Raster 1 rather than processing them individually. In other words, let’s try to use the Boolean function AND (“&”) to write and evaluate four queries that create a Raster 1. Give the output name for the raster dataset Raster_1 or some other name (e.g., Cloudless_60) that is catchy to you:
Bonus: If you want to learn more about processing raster using Map Algebra, please visit the ArcGIS Resources (https://www.esri.com/en-us/arcgis/products/arcgis-pro/resources) under the topics, such as How Raster Calculator works, and Build expressions in Raster Calculator
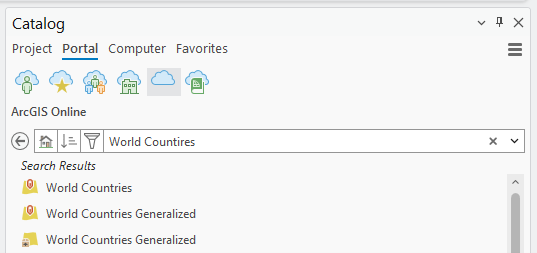
6. To enhance visualization, find “World Countries” in the Portal in the Catalog:
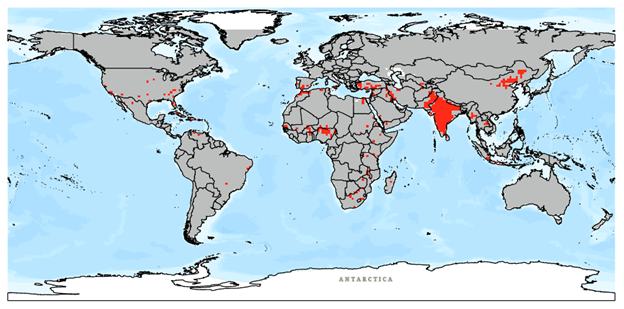
7. Make the World Countries layer colorless, so the border lines are presented. Here is an example of cloudless_60pct:
Map (2 pts.) and Question (1 pt.)
1. Make professional (!) maps of your three raster outputs cloudless_60pct, cloudless_70pct, or cloudless_75pct.
- Rename the raster datasets and labels (e.g., 0, 1) to something meaningful, g., 0 for Low and 1 for High, so the company understands your map.
- You can change the name of the raster datasets and labels in each layer’s Properties window (General tab for name, Symbology tab for colors and brands).
- Make the color palettes of the three rasters match for easier comparison. The True values (1s) should be a solid color, while the False values (0s) should have no color. Use the included countries layer in your map as a reference background layer.
Remember to add a map title, your name, a legend, a scale bar, a north arrow, a neat line, etc. Be sure to label the panels so the client knows which panel belongs to each model output. Use bright, obvious colors for the raster cells, and make sure countries are not prominent parts of the map (e.g., a hollow and a thin, light-gray border work well).
2. Question: Which of the three raster datasets (cloudless_60pct, cloudless_70pct, or cloudless_75pct) do you think is the most appropriate for your final analysis? Why?