
6. Create a map layout that incorporates multiple data frames
We will make a visually efficient map to compare the four contiguous US layers. In other words, we will put four layers, which should be the same size, into one map layout and add a graticule to depict coordinate systems.
1. Open a map layout by Insert > New Layout and choose ANSI-Landscape Letter 8.5’’ X 11’’
2. Click Map Frame, choose “Albers,” and drag it to the first quadrant:
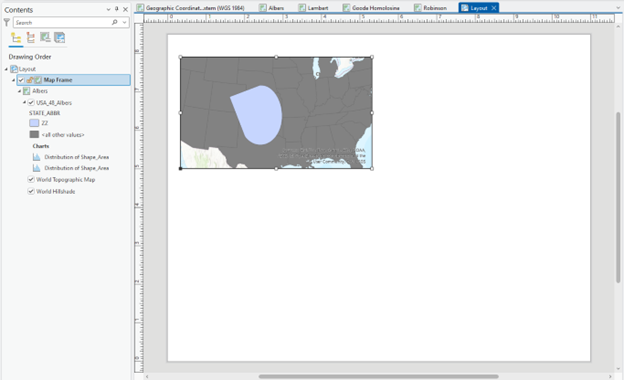
Stop and check: Consider using “rulers” to divide the map layout into four quadrants.
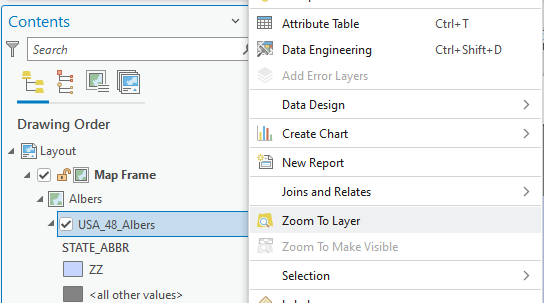
3. You might have a “zoomed-out” (or “zoomed-in”) figure on your map, like the above. To show it to its full extent, right-click USA_Albers and choose Zoom To Layer:
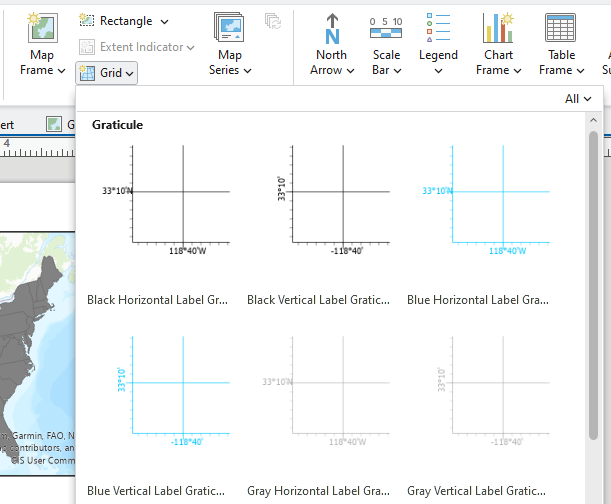
4. You will add a graticule to the USA_Albers map. Click the USA_Albers map frame in your Layout (to activate the Grid), click the drop-down in Grid, and choose Black Horizontal Label Graticule (or any other choice of yours):
5. Add three projected layers to fill the rest of the quadrants and put the Graticule in them.
Stop and Think: What is the role of a graticule in a map? What is the benefit of a graticule in your map layout?
6. Put titles, i.e., Albers Equal Area Conic, Lambert Conformal Conic, and Goode Homolosine, Robins, on top of each map frame.
7. Add a scale bar and a North arrow.
8. Export the map to a figure format, such as TIFF, JPEG, or BMP.
Final Deliverable
Map (2 pts.): The final map requirements are:
- Show the four contiguous US layers as the same size in ONE map layout.
- Include the title of each layer, graticule, scale bar, and North arrow.
Question (2 pts.): Compare and contrast the conterminous US maps by 1) the shape of each figure and 2) the calculated area from Table 1. (Note: Please focus on which map projections show similar visualizations and area measurements and why.)
Credits: The original version of this lab module was developed by the Department of Geography at UC Santa Barbara and used with permission. The original UCSB lab was tailored for instruction at the Department of Geography, Indiana University Bloomington, by Dr. Darren Ficklin and Dr. Yuri Kim.