
1. Introduce ArcGIS Portal and a scanned map
Add GIS data from the ArcGIS Online Portal.
We will find a country boundary vector dataset through the “Portal” in ArcGIS Pro. A Portal is a website that allows us to share data and work with others, and it can be connected by providing a URL to ArcGIS Pro. Connections can be added, removed, and edited from the Portals page in ArcGIS Pro.
1. Open ArcGIS Pro and create your Lab 3 workspace.
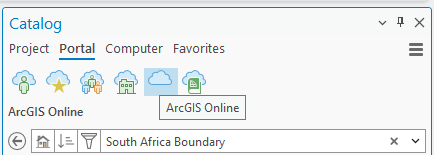
2. In the Catalog (it will be on the right side of the ArcGIS Pro), click Portal, choose the fifth icon, ArcGIS Online, and type “(your) Country Boundary” in the search box:
3. Select the County Boundary and drag it to the Map:
4. Right-click the country boundary layer and select Zoom to Layer to view the full extent of the country.
Getting a scanned map
4. In the Canvas Lab 3 assignment space, find the map you got from the class. Add the TIFF map to ArcGIS Pro. You might get a message: “Build Pyramids and Calculate Statistics for (your map).tiff.” Click Yes:
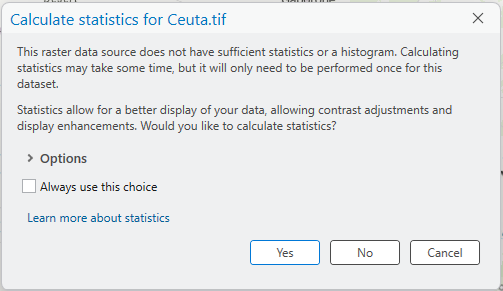
Stop and Think: Why this message? When handling large raster data sizes, e.g., greater than 1,024 pixels, the “pyramid” method is often automatically applied in ArcGIS Pro to improve display efficiency.
Stop and Check: We got an “Unknown Coordinate System warning message.” The map was not presented in the Map frame, though it appeared in the Contents pane.
5. Click the Imagery tab and choose Georeference. The Georeferencing box pops up in the Map frame:
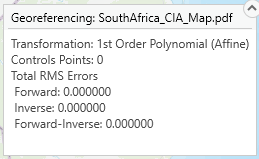
Stop and Remember: Please link your knowledge from one of the pre-class readings about Transformation, Control points, and RMSE in georeferencing to this process.
6. Click the Fit to Display icon and check out how your country boundary aligns with the scanned map:
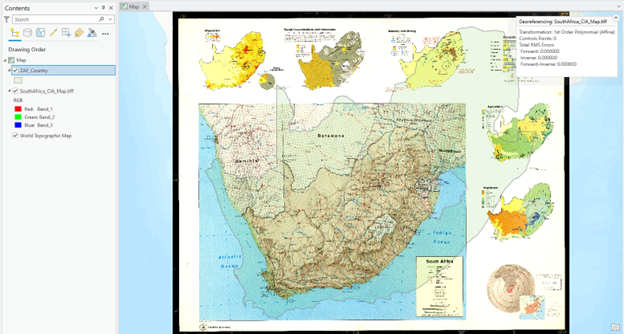
Stop and Observe: Now, we can find the scanned map and the country boundary in the Map frame, as the “Fit to Display” feature temporarily updates the spatial reference of the scanned grid map. However, the edges of the two maps are not precisely matched.