
5. Calculate the area from different map projections
The three “projected” layers, i.e., Albers, Lambert, and Robins, have a “meter” unit so that you can measure the area of each polygon. We are going to get two statistics from each projected layer:
- The area of the test polygon, in other words, “ZZ.”
- The area of the conterminous US, excluding the test polygon
Stop and revisit the USA_48 layer: What was its spatial reference? What measurement unit does it have? — Meters? Feets? Or anything else? Do you think we can calculate the conterminous US area from the “USA_48” layer? Why and why not?
1. Right-click USA_48_Albers and choose Attribute Table
2. On the table, scroll to the right to find “Shape_Area.”
Stop and Do it: Write down the Shape_Area of “ZZ” in STATE_ABBR. This is the test polygon that we need to exclude to get the area of the conterminous US.
3. Right-click “Shape_Area” on the attribute table and choose Visualize Statistics:
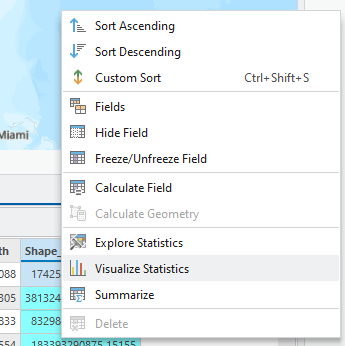
4. In Chart Properties (on the right side of your ArcGIS Pro), you only need “Sum.” However, keep in mind that this total sum includes the test polygon. To get the contiguous US, you should subtract “ZZ” from the Sum.
Question 1 (3 pts.): Fill in the table
1. Fill in the table
| Area (m2) | Albers | Lambert | Goode Homolosine | Robinson |
| Test Polygon (ZZ) | ||||
| Contiguous US |
2. Explain why the areas were different in the four maps.