"

2. Create polygons

1. In the Catalog pane, right-click Lab04 (aka your workspace), click New, and choose Shapefile.

2. The Create Feature Class tool appears in the Geoprocessing tab. Fill in the parameters with the following:

    • Feature Class Name: Lake
    • Geometry Type: Polygon
    • Coordinate System: Click the drop-down icon and choose your georeferenced map.

3. Click Run. Then, you can find the “Lake” in the Contents pane.

4. Make your scanned map to the full extent in the Map view:
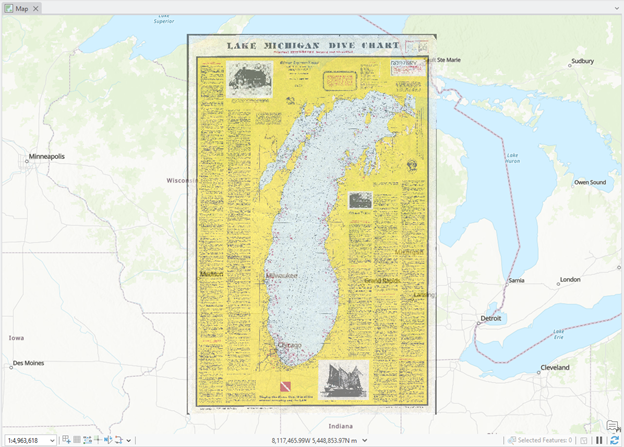
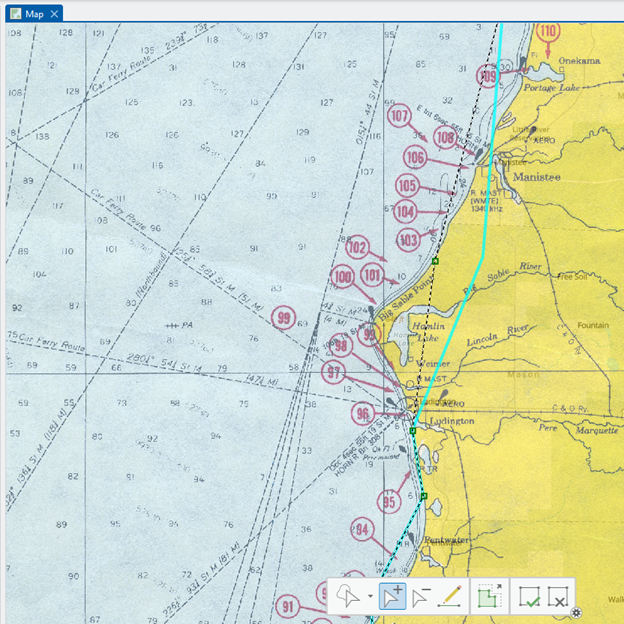
Map titled "Lake Michigan Dive Chart" overlaid on a broader geographical map of the United States and Canada. The dive chart highlights various diving locations in Lake Michigan using symbols and descriptive labels. The background map includes major cities such as Minneapolis, Detroit, and Cleveland, and regions like Wisconsin and Ontario.
Lake Michigan Dive Chart: Explore Depths, Shipwrecks, and Surrounding Geography from Minneapolis to Sault Ste. Marie.

First, we will make a “rough boundary of the lake.

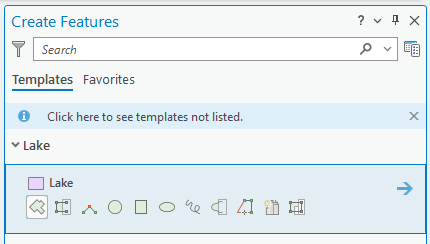
5. On the Edit tab in the Ribbon, click Create. Then click the “Lake” in the Create Features tab and choose the Polygon.

Screenshot of a software interface for creating features. The interface includes a search bar, tabs labeled 'Templates' and 'Favorites,' and a message stating 'Click here to see templates not listed.' Below, a section labeled 'Lake' displays a purple square icon labeled 'Lake.' Various icons for drawing shapes like polygons, circles, and lines are shown.
Create Features Panel in GIS Software: Tools and Templates for Designing Lake Elements.

6. Draw the edge of the lake “roughly” like the figure below:

Detailed dive chart titled 'Lake Michigan Dive Chart' featuring a light purple outline of Lake Michigan centered on a yellow background. The map includes extensive textual annotations, black-and-white images, and various symbols such as arrows, shapes, and checkboxes at the bottom.
Lake Michigan Dive Chart: A comprehensive visual guide to notable dive sites, depths, and historical highlights across the lake.

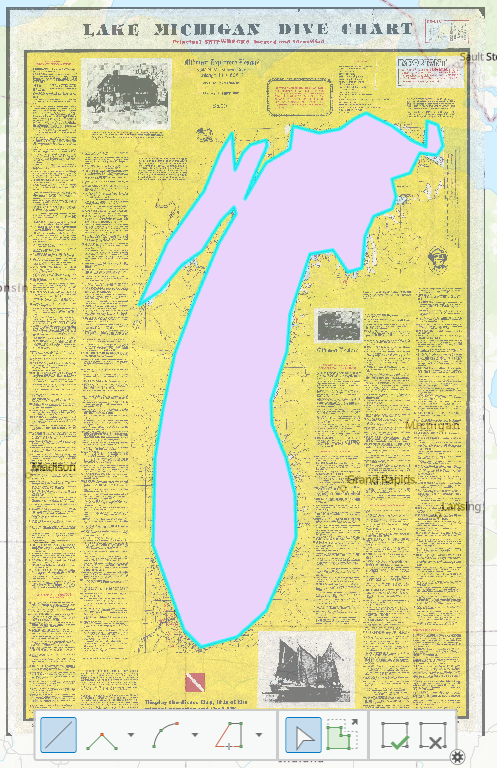
7. To remove the cyan-colored polygon (meaning this polygon is “selected” and further editing is impossible) boundary, click the Clear icon on the Edit tab:

Make alt text for this image with WCAG 2.2 standards
GIS Software Toolbar: Feature editing and management tools under the ‘Edit’ tab, including topology, snapping, and selection options.

8. Open the Symbology of the lake polygon and choose “Black Outline” so that you can see inside the water body

Now, we will edit your rough drawing by zooming in on a part of the lake.

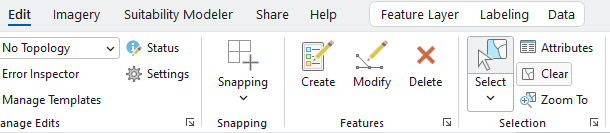
9. Zoom in on a location that you want to edit. Click Modify in the Edit tab and find Edit Vertices:

Nautical chart of the Straits of Mackinac showing water depths, red numbered navigational markers, and coastal features. The left side displays blue water with depth contours; the right side shows a yellow landmass with labeled coastlines. An inset in the top right corner features a photo of the ship 'Midwest Explorer' and descriptive text about the straits, including historical and navigational details.
Navigating the Straits of Mackinac: A nautical chart paired with the ‘Midwest Explorer’ overview and map editing tools for modifying geographic features.

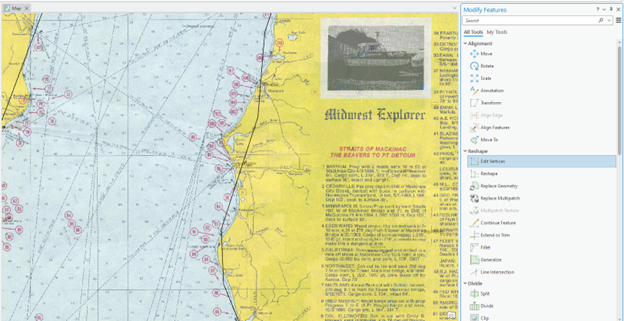
10. Drag a vertex to a location that you want to adjust. If you want to put more vertices while you are editing, use the Add icon:

Nautical chart of the coastal area around Ludington, Michigan, showing depth contours in feet, red numbered navigational markers (e.g., 99, 98, 97), and labeled landmarks such as Hamlin Lake, Weimer, R MAST, C G AERO, and RTR. The chart includes navigational lines and symbols, with annotations like 'OCC 4sec 55ft 18M HORN Bn (2)30s' and 'QK Fl R Priv maint' indicating light and sound signals.
Nautical Chart of the Ludington Area with the Modify Features Tools

Deliverable

  • Map (2 pts.): Try to create a professional (!) map of Shipwreck points and Lake boundary with a proper layout. Please include the map elements – figures, legend, title, north arrow, and scale bar. (Reminder: please revisit Lab 1 if you need an extra guide.) Export your map to a figure format (e.g., TIFF, JPEG, etc.).
  • Shapefiles (5 pts.): Make one zip file with all your digitized points and polygons and upload it to Canvas Lab 4 space.


License

Intro GIS Labs Copyright © by yurikim. All Rights Reserved.