"

2. Find Control Points: Think-Pair-Share

The Control Points are the noticeable features linking the base map and the scanned map. The best candidates for Control Points in Georeferencing are places or entities whose location is unlikely to change, such as road intersections, building corners, and streets. Through this lab, we will use “place,” like cities and towns, as our control points.

Stop and Discuss: Explore the area by zooming in and out to search for suitable locations as Control Points. Throughout the lab, please frequently discuss with your classmates to identify feasible control points!

1. Make the scanned grid map transparent so the label can be seen on the base map. Click Raster Layer on top of the ArcGIS Pro, find Transparency, and put 50.0% in it.

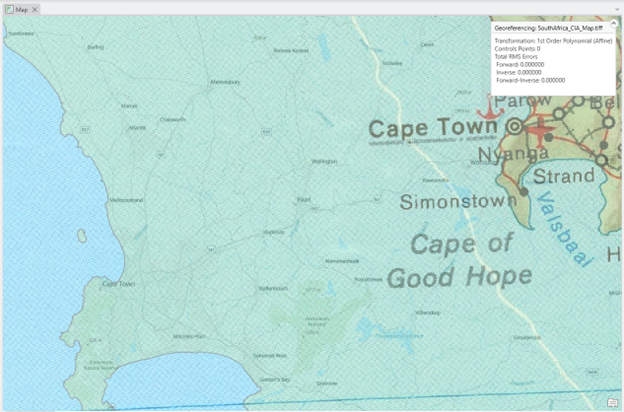
2. On this map, we will focus on the location (e.g., city, town, road junction, etc.) where the base map and scanned map synchronize. Find suitable locations to set control points and zoom in, like the figure below:

Map of the Cape Town area in South Africa, showing labeled locations including Cape Town, Simonstown, and the Cape of Good Hope. Geographic features such as coastlines and water bodies are visible. An information box in the upper right displays georeferencing parameters, including transformation type, control points, and RMS error values.
Map of Cape Town and the Cape of Good Hope region in South Africa, showing nearby towns and georeferencing details in an inset box.

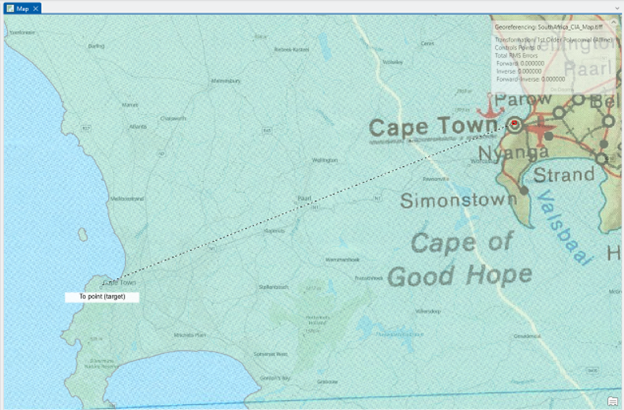
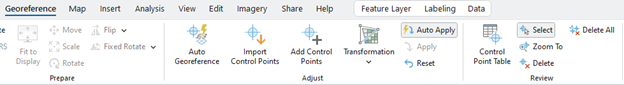
3. As an example, I will add the first Control Point in Cape Town, where the location is straightforwardly comparable. Click the Add Control Points icon in the Georeference tab.

4. First, click one location on the “scanned map” (Heads up: clicking on the scanned map FIRST is VERY important for the correct outcome!). Then double-click the suitable location on the “base map”:

Map of the Cape Town region in South Africa, showing labeled locations including Cape Town, Nyanga, Simonstown, and the Cape of Good Hope. A dotted line extends from a coastal point labeled "To point (target)" to Cape Town. Geographic coordinates and location markers are also visible.
Georeferencing map of the Cape of Good Hope region showing a dotted route from Cape Town to a coastal target point, with labeled towns and inset georeferencing details.

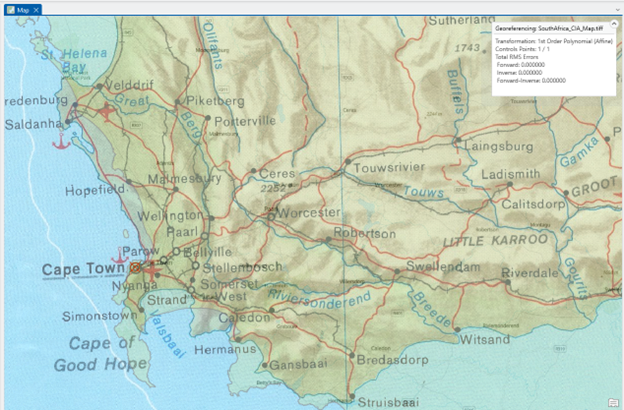
5. Now, the first Control Point successfully matches the locations:

A detailed map of the southwestern region of South Africa, featuring major cities and towns including Cape Town, Paarl, Stellenbosch, Worcester, and Swellendam. The map displays geographical features such as rivers and mountain ranges, and includes coastal labels like St. Helena Bay and Cape of Good Hope along the Atlantic Ocean. An information box in the upper right corner contains georeferencing data.
Map of the Western Cape region in South Africa, showing major towns including Cape Town, Stellenbosch, Paarl, Worcester, and Swellendam, along with rivers, mountain ranges, and coastal landmarks such as Saldanha Bay and the Cape of Good Hope.

6. Repeat setting control points at FIVE different locations – try to distribute the Control Points evenly throughout the entire area, like this example:

A detailed topographic map of South Africa and neighboring countries including Namibia, Botswana, Zimbabwe, Mozambique, and Eswatini. The map displays geographical features such as mountains, rivers, and cities, with several marked points using red and yellow symbols. A legend in the bottom right corner explains the symbols, and an inset shows vegetation types across South Africa. Georeferencing data is included, noting a 1st Order Polynomial (Affine) transformation with 7 control points and a total RMS error of 1.17.
Georeferenced topographic map of South Africa and surrounding countries, showing major cities, capital locations, rivers, mountain ranges, and vegetation zones. Includes transformation data and a legend explaining map symbols.

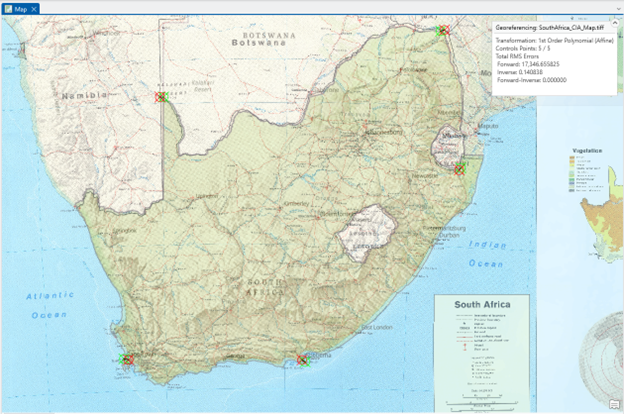
Stop and make a rough estimate: After setting five control points, visually evaluate whether the scanned map is reasonably (please stay sane and don’t be too picky!) aligned with the base map. If it doesn’t, please start over and reposition the control points. 

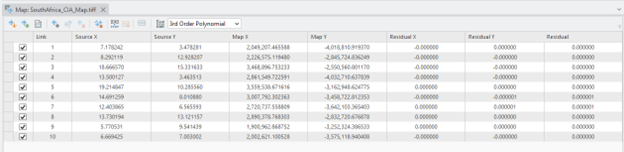
7. Add more control points up to TEN, and click the Control Point Table to open the table. Change the image transformation method from 1st order polynomial to 3rd Order Polynomial:

Screenshot of a data table from a software application showing map coordinate information. The table includes columns labeled "Link," "Source X," "Source Y," "Map X," "Map Y," "Residual X," and "Residual Y." Each row contains numerical values or placeholders. All checkboxes in the "Link" column are checked. Some rows have complete data, while others contain blanks or symbols like underscores and equals signs.
Data table showing source coordinates, mapped coordinates, and residuals from a 3rd order polynomial transformation used in mapping analysis.

8. Close the Control Point Table

9. Now, you will set 25 – 30 control points throughout the scanned map. Again, try to distribute Control Points evenly across the entire area, but don’t be overly cautious.

Helpful Tip 1: Before exploring other areas, go to the Map tab and click the Explorer icon. Once you have found the location to set the Control Point, click the Add Control Points icon in the Georeference tab and repeat it.

Helpful Tip 2: You can use Select and Delete if you remove them:

Screenshot of the Georeference toolbar in a GIS software interface. The toolbar is divided into sections: "Prepare" with tools like Fit to Display, Move, Scale, Flip, and Rotate; "Adjust" with Auto Georeference, Import Control Points, and Add Control Points; "Transformation" with a dropdown menu, Apply, and Reset buttons; and "Review" with options including Auto Apply, Select, Delete All, Control Point Table, Zoom To, and Delete.
The georeferencing toolbar in GIS software features tools for setting control points, applying transformations, and adjusting geospatial data.


Helpful Tip 3: Examples of ~ 25 Control Points location and the georeferenced outcome could be

A detailed geographic map of South Africa and neighboring countries including Namibia, Botswana, Zimbabwe, and Mozambique. The map displays cities, rivers, and mountain ranges, with multiple orange cross symbols marking specific locations. A small information box in the top right corner provides georeferencing details: transformation type is 2nd order polynomial, residuals are 27 pixels, total RMS error is 2.61245383, and forward X/Y ranges are 0–6001 and 0–6003 respectively.
Georeferencing South Africa: A detailed map displaying control points marked with orange crosses and transformation parameters using a 3rd order polynomial method.

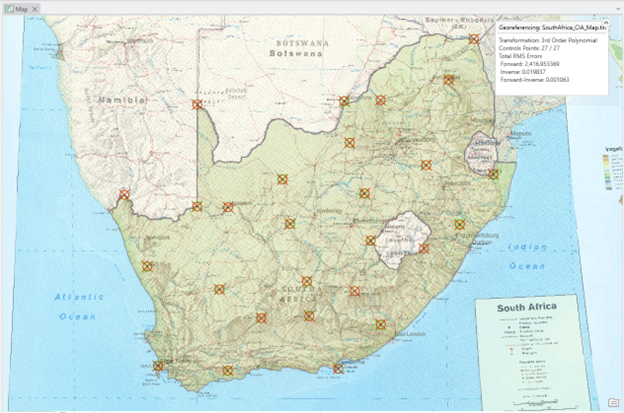
10. Open the Control Points setting. We can check the Control Point statistics by opening the Control Point Table in Georeferencing:

Screenshot of the Georeference toolbar in a GIS software interface. The toolbar is divided into sections: "Prepare" with tools like Fit to Display, Move, Scale, Flip, and Rotate; "Adjust" with Auto Georeference, Import Control Points, and Add Control Points; "Transformation" with a dropdown menu, Apply, and Reset buttons; and "Review" with options including Auto Apply, Select, Delete All, Control Point Table, Zoom To, and Delete.
The georeferencing toolbar in GIS software features tools for setting control points, applying transformations, and adjusting geospatial data.

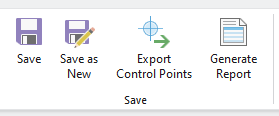
11. Save your ground control points by using the Export Control Points and Generate Report tool, and name it “CP.txt.”:

Screenshot of a toolbar section titled "Save" in a GIS software interface. It contains four icons with labels: "Save" (floppy disk), "Save as New" (floppy disk with pencil), "Export Control Points" (crosshair with arrow), and "Generate Report" (document icon).
Toolbar functions for managing project data: Save, Save as New, Export Control Points, and Generate Report.

12. Right-click the scanned TIFF map (e.g., “SouthAfrica_CIA_Map.tiff”, choose Data > Export Raster, and name it “SouthAfrica_CIA_Map_ref.tiff)

Deliverable

1. Make a screenshot of your ~25 control points and the Georeferencing RMS Errors box, like “Helpful Tip 3.” (1 pt.)

2. Submit your “Generate Report” and “CP.txt” (1 pt.)

3. Question (2 pts.): How many Control Points did you set for your georeferencing? What is your Total RMS Error, and what does this mean?

(Useful resource about RMS Error: Please read the “Interpret the root mean square error” in ArcGIS Pro Help,  https://pro.arcgis.com/en/pro-app/latest/help/data/imagery/overview-of-georeferencing.htm)

4. Submit your final georeferenced TIFF file (2 pts.)


License

Intro GIS Labs Copyright © by yurikim. All Rights Reserved.