
4. Process Raster with Vector (2): Zonal Statistics as Table
In this section, we are particularly interested in the tree cover and imperviousness in Monroe County, and we will compare them with census tract-level demographics. We need to obtain the mean value of the percent tree cover and impervious area in each census tract polygon. As the tree cover and imperviousness are rasters, and the census tract is a polygon vector, we will use the Zonal Statistics as Table tool to calculate the statistics of the underlying raster data in each polygon.
Stop and Tip, in case you are processing both Vector and Raster for your project: As you might notice, ArcGIS Pro categorizes and makes hierarchies of tools in “Toolboxes” in the Geoprocessing tab for specific purposes (e.g., Analysis, 3D, Conversion, etc.) or data format (e.g., vector, raster, text, etc.). The tool’s name, “Zonal Statistics…”, is the one from which we can get values from the raster and match them to the vector.
1. Add NLCD_2024_Tree_Canopy.tiff and NLCD_2024_Impervious.tiff
2. We will obtain the percent tree canopy cover within each census tract. In the geoprocessing, search Zonal Statistics as Table, and fill in the parameters like:
-
- Input Raster or Feature Zone Data: Monroe_BlockGroup_2025_UTM
- Zone Field: spatial_id
- Input Value Raster: NLCD2024_Tree_Cover.img
- Output Table: Tree_pct
- Statistics Type: Mean
- And click Run
3. Repeat Zonal Statistics as Table using NLCD2024_mperviousness.img:
-
- Input Raster or Feature Zone Data: Monroe_BlockGroup_2025_UTM
- Zone Field: spatial_id
- Input Value Raster: NLCD2024_mperviousness.img:
- Output Table: Impervious_pct
- Statistics Type: Mean
- And click Run
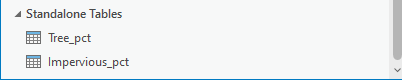
4. We can find two text-format tables at the bottom of the Content pane under Standalone Tables:
5. Then, we will process the Join using two Zonal statistics as Table outputs and the Monroe census tract vector. Right-click Monroe_BlockGroup_2025_UTM, find Join and Relates, and click Add Join. First, join the Tree_pct table to look like the figure below:
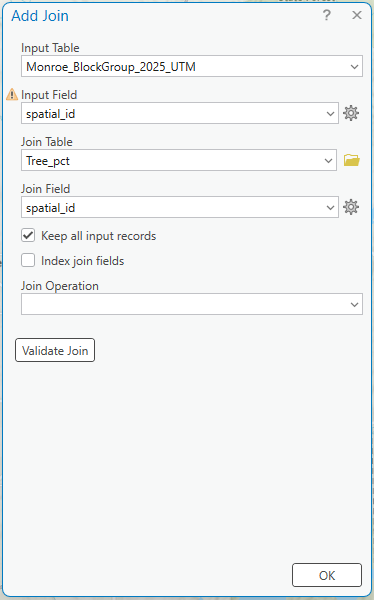
6. Next, join another table, i.e., Impervious_pct, to the Monroe Census Track layer, like
-
- Input Table: Monroe_BlockGroup_2025_UTM
- Input Join Field: spatial_id [Monroe_BlockGroup_2025_UTM.spatial_id]
- Join Table: Impervious_pct
- Joint Table Field: spatial_id
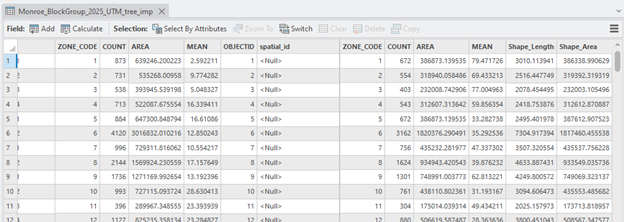
7. We need to make the “joined” layer a permanent GIS layer using the Export Features tool; Right-click the Monroe_census_tract, go to Data, and choose Export Features. Name the Output Feature Class Monroe_BlockGroup_2025_UTM_track_tree_imp
8. Open the attribute table of the Monroe_BlockGroup_2025_UTM_track_tree_imp to ensure the tree cover and imperviousness percentage data are properly attached:
Stop and Reminder: Why “Export Feature” after the JOIN process?
“Join” temporarily glues the text format table to the GIS layer. The “Export Feature” tool creates another GIS layer. In our case, the tree and impervious percentage data will be permanently attached to the Monroe census tract polygon after completing the Export Features process.