
2. Vector Analysis using Select and Buffer
Now that we have raster layers showing potential areas for solar power generation, we also need to identify which major cities could benefit from solar power. As we learned in the previous labs, buffering calculates distances from vector features and then produces polygons that represent the area surrounding the features out to that distance. Using buffers, we will determine which major cities are within 50 miles of potential power generation regions.
1. Add the cities layer to ArcGIS
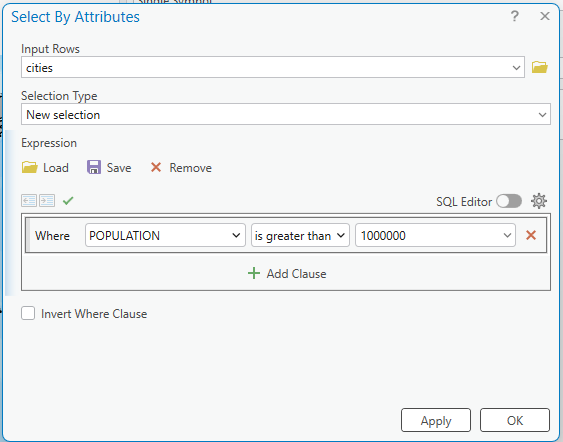
2. Let’s select cities with a population greater than 1 million. Click the Select By Attributes icon in the Map tab and fill in the Parameters as shown in the figure below. Click OK:
3. Save the selected cities as a new layer. Right-click cities > Data > Export Features. Name the output as “cities_1million” and click OK.
4. The newly selected cities feature class will be added to your Map
Stop and check: Before moving forward, choose Clear Selected Features in the Map tab to remove the selection from the previous step in the cities layer.
5. Now, we will create a 50-mile buffer around the cities_selection layer. Find Buffer in the Geoprocessing and fill in the parameters like:
-
- Input Features: cities_1million
- Output Feature Class: cities_1million_Buffer50
- Distance: 50 Statute Miles
- Method: Planar
- Dissolve Type: No Dissolve
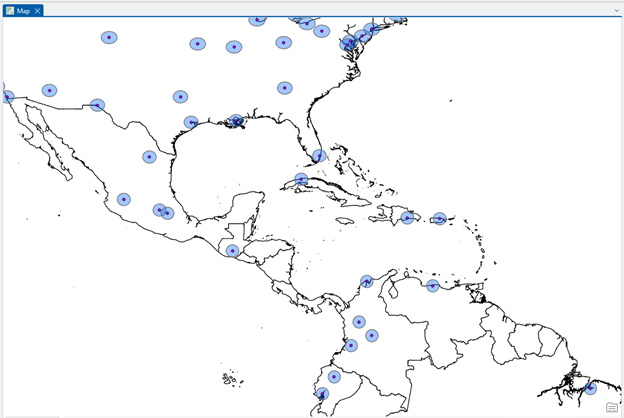
6. Zoom in on a city to look at the 50-mile buffer – it’s hard to see the buffers at a global scale:
Next, you need to find out which of these buffers intersect with the solar power production regions identified by your raster model. Before performing the intersection, however, you must decide which power-region raster datasets to use in your analysis. Based on your answer for Part 1, determine what output rasters (e.g., cloudless_60pct, cloudless_70pct, or cloudless_75pct) you should use for your project.
The fact is that potential power regions are “pixels” in a raster layer, and cities are “points” in a vector layer. It causes a complication in your analysis since these are different data models. To solve this problem, you need to convert the raster to a vector layer.
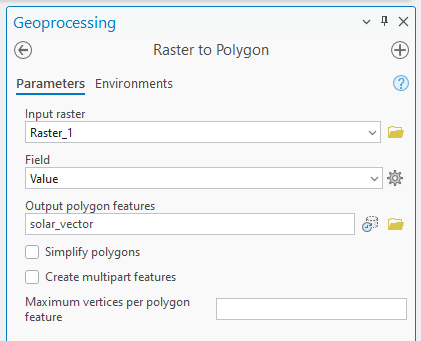
7. Open the Raster to Polygon tool in the Geoprocessing, fill in the parameters, and please UNCHECK the Simplify polygons box:
8. Change the Symbology on the solar_vector layer:
-
- Primary symbology: Unique Values
- Field 1: gridcode
Stop and Think: You can find two gridcode values, 0 and 1. What do 1 and 0 mean?
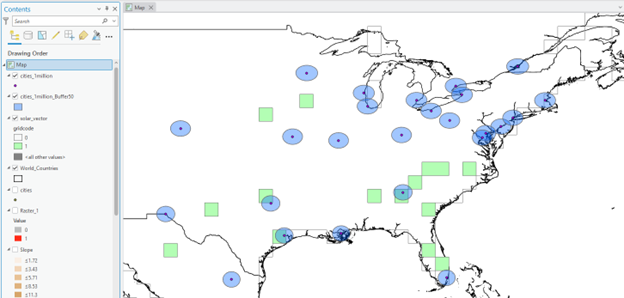
We can find that some city-buffer polygons overlap with the potential solar power generation area:
Now that all datasets are vector layers, we can use the Select By Location tool to identify which buffers fall within the potential solar power locations. First, however, since you want to find which buffers intersect with areas of possible use only, we must make sure that these potential area polygons are selected beforehand (i.e., solar_vector, GRIDCODE is 1).
9. Open Select by Attribute and select the polygons in the solar vector that have a value of GRIDCODE = 1.
10. Then, use Select by Location to select the buffers that intersect your selected solar_vector:
-
- Input Features: cities_selection_Buffer50
- Relationship: Intersect
- Selecting Features: solar_vector
- And click Run
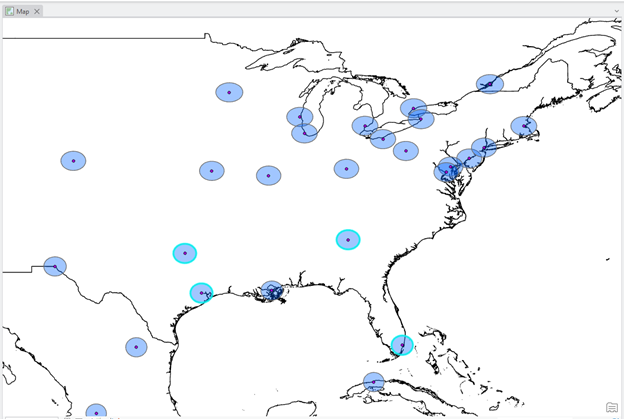
Some buffer polygons that intersect with the solar vector gridecode = 1 are now visualized with cyan color.
11. Uncheck the solar_vector. And make sure that some buffers are selected in your cities_selected_Buffer50:
12. Now, determine which city points fall within the selected city buffers. A bit of a challenge for you; you are on your own for this part. However, a helpful hint: use the Selection By Location tool, as in the previous step.
13. Export your selected cities as a separate layer – name it cities_final.
14. Clear the selection
Map (2 pts.) and Question (1 pt.)
1. Make a high-quality map showing ALL the potential cities (i.e., cities_final layer) that meet the criteria for solar power generation.
- Use the included country boundary layer in your map
- Label the city names, and
- Include a text box briefly explaining the criteria for selecting these potential cities. The map also needs a title, your name, a legend, a scale bar, a north arrow, a neat line, etc.
2. Question: In which country would you advise the company is a good location for investment in solar power generation? Which is the most crucial city in that country? Explain your reasons for both answers. (Hint: Check the Attribute table of your cities_final)