
Climate change is a topic that comes into all aspects of environmental sustainability. Here, we will address the atmospheric and climatic aspects of climate change, but we will see it many other chapters as well.
Earth’s Temperature is a Balancing Act
As we saw in Chapter 1, Earth’s temperature depends on the balance between energy entering and leaving the planet. When incoming energy from the sun is absorbed, Earth warms. When the sun’s energy is reflected back into space, Earth avoids warming. When energy is released from Earth into space, the planet cools. Many factors, both natural and human, can cause changes in Earth’s energy balance, including:
- Changes in the greenhouse effect, which affects the amount of heat retained by Earth’s atmosphere;
- Variations in the sun’s energy reaching Earth;
- Changes in the reflectivity of Earth’s atmosphere and surface.
Scientists have pieced together a picture of Earth’s climate, dating back hundreds of thousands of years, by analyzing a number of indirect measures of climate, such as ice cores, tree rings, glacier size, pollen counts, and ocean sediments. Scientists have also studied changes in Earth’s orbit around the sun and the activity of the sun itself.
The historical record shows that the climate varies naturally over various time scales. In general, climate changes before the Industrial Revolution in the 1700s can be explained by natural causes, such as changes in solar energy, volcanic eruptions, and natural changes in greenhouse gas (GHG) concentrations. However, recent warming cannot be explained by natural causes alone, especially since the mid-20th century. Rather, human activities, especially our combustion of fossil fuels, explain most of that warming. The scientific consensus is clear: through alterations in the carbon cycle, humans are changing the global climate by increasing the impacts of the greenhouse effect.
The Greenhouse Effect Causes the Atmosphere to Retain Heat
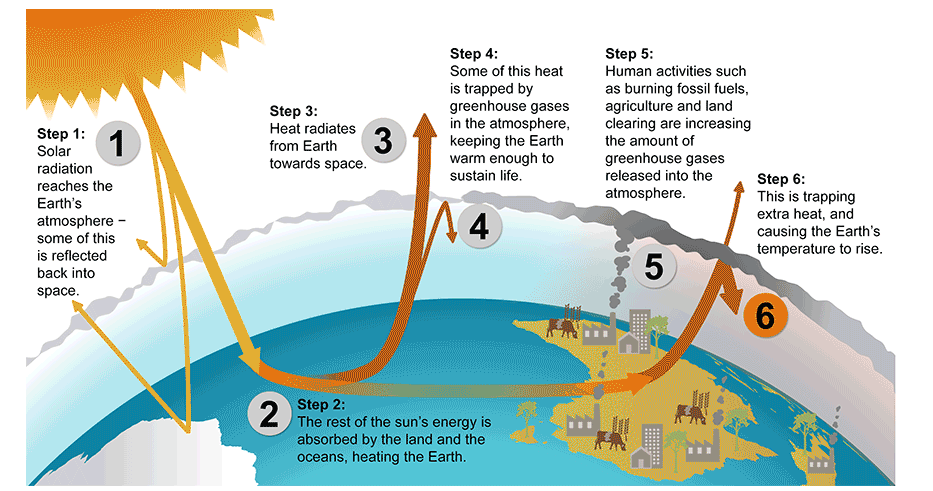
Much like the glass in a greenhouse, GHGs allow incoming visible light energy from the sun to pass, but they block infrared radiation radiating from Earth toward space (Fig 1). In this way, they help trap heat energy that subsequently raises air temperature. Being a greenhouse gas is a physical property of certain types of gases; because of their molecular structure, they absorb wavelengths of infrared radiation but are transparent to visible light. The major greenhouse gases are water vapor (H2O), carbon dioxide (CO2), methane (CH4) and nitrous oxide (N2O). Scientists estimate that the average temperature on Earth would be -18º C without naturally-occurring GHGs.
| What is Global Warming? |
| Global warming refers to the recent and ongoing rise in global average temperature near Earth’s surface. It is caused mostly by increasing concentrations of greenhouse gases in the atmosphere. Global warming is causing climate patterns to change. However, global warming itself represents only one aspect of climate change. |
| What is Climate Change? |
| Climate change refers to any significant change in the measures of climate lasting for an extended period of time. In other words, climate change includes major changes in temperature, precipitation, or wind patterns, among other effects, that occur over several decades or longer. |
The Main Greenhouse Gases
The most important GHGs directly emitted by humans are CO2, methane (CH4), and nitrous oxide (N2O). Carbon dioxide is the primary greenhouse gas that is contributing to recent global climate change. CO2 is a natural component of the carbon cycle, involved in such activities as photosynthesis, respiration, volcanic eruptions, and ocean-atmosphere exchange. Human activities, primarily the burning of fossil fuels and changes in land use, release very large amounts of CO2 into the atmosphere, causing its concentration in the atmosphere to rise.
Atmospheric CO2 concentrations have increased by 45% since pre-industrial times, from approximately 280 parts per million (ppm) in the 18th century to 425 ppm in 2025 (Figure 2). The last time that Earth’s CO2 concentration was so high was 3-5 million years ago. Human activities currently release over 40 billion tons of CO2 into the atmosphere every year, about 88% of which was from burning of fossil fuels (Figure 3, 4). While some volcanic eruptions released large quantities of CO2 in the distant past, in the present, volcanos emit, on average, less than half a billion tons of CO2, annually. https://www.science.org/content/article/scienceshot-volcano-co2-emissions-no-match-human-activity
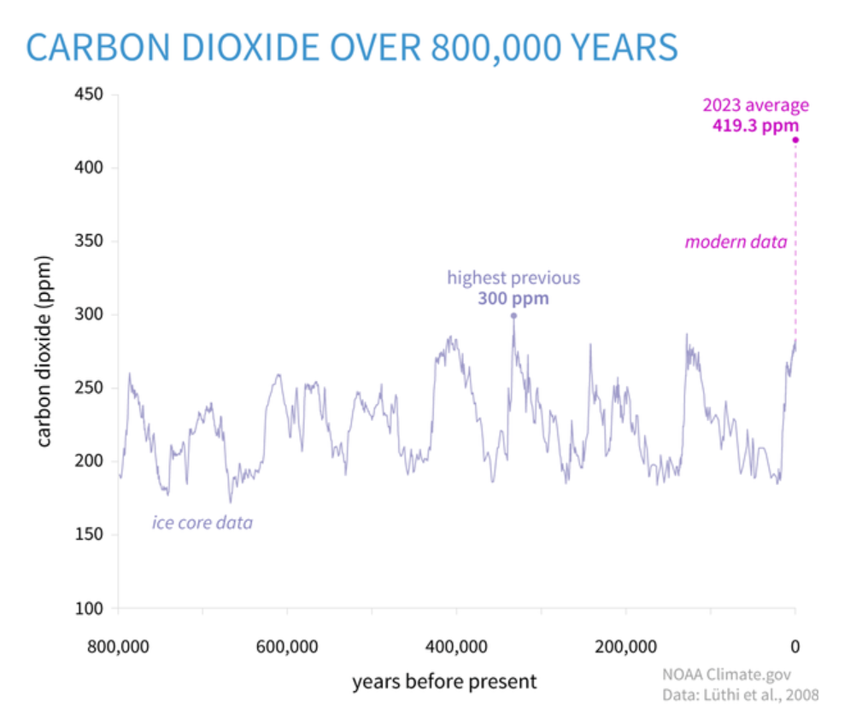
Figure 2. Atmospheric carbon dioxide (CO2) in parts per million (ppm) for the past 800,000 years based on ice-core data (light purple line) compared to 2022 concentration (bright purple dot). Graph by NOAA Climate.gov based on data from Lüthi, et al., 2008, via NOAA NCEI Paleoclimatology Program.
Deep ice cores from Antarctica preserve a record of atmospheric gases going back 800,00 years, in small bubbles trapped in the ice as it formed. The peaks and valleys in the line show ice ages (low CO2) and warmer interglacials (higher CO2). Throughout that time, CO2 was never higher than 300 ppm (light purple dot, between 300,000 and 400,000 years ago). The increase over the last 60 years is 100 times faster than previous natural increases. In fact, on the geologic time scale, the increase from the end of the last ice age to the present (dashed purple line) looks virtually instantaneous. Graph by NOAA Climate.gov based on data from Lüthi, et al., 2008, via NOAA NCEI Paleoclimatology Program.
Methane (CH4) is produced through both natural and human activities. For example, wetlands, agricultural activities, fossil fuel extraction, and transportation emit CH4. Methane is more abundant in Earth’s atmosphere now than in at least the past 650,000 years. Due to human activities, CH4 concentrations increased sharply during most of the 20th century and are now more than two-and-a-half times pre-industrial levels. In recent decades, the rate of increase has slowed considerably.
Nitrous oxide (N2O) is also produced both naturally and anthropogenically. Globally, 40% of N2O comes from anthropogenic sources. In the US, 75% of anthropogenic N2O comes from agriculture, primarily as a result of use of nitrogen fertilizers.
A number of other greenhouse gases are produced in smaller quantities than these leading three. Some, including fluorinated gases, also harm the stratospheric ozone layer.
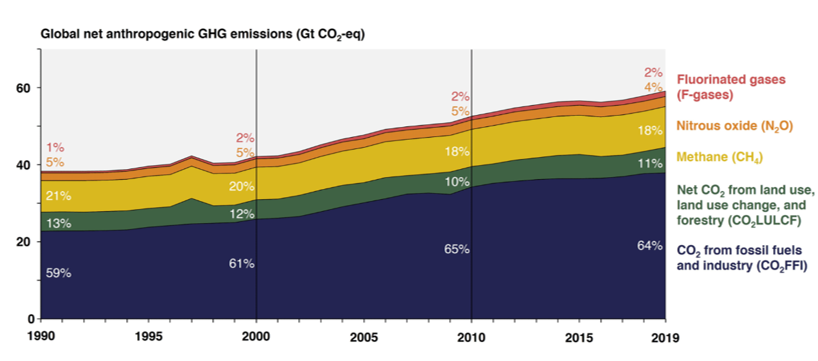
Figure 3. Recent increases in concentrations of major greenhouse gases. From https://www.epa.gov/ghgemissions/global-greenhouse-gas-overview. Data from the Working Group III report of the IPCC (2022).
EPA describes their fluorinated gas category this way: “Industrial processes, refrigeration, and the use of a variety of consumer products contribute to emissions of F-gases, which include hydrofluorocarbons (HFCs), perfluorocarbons (PFCs), and sulfur hexafluoride (SF6).” These compounds are also chemicals that harm the ozone layer. https://www.epa.gov/ghgemissions/global-greenhouse-gas-overview.
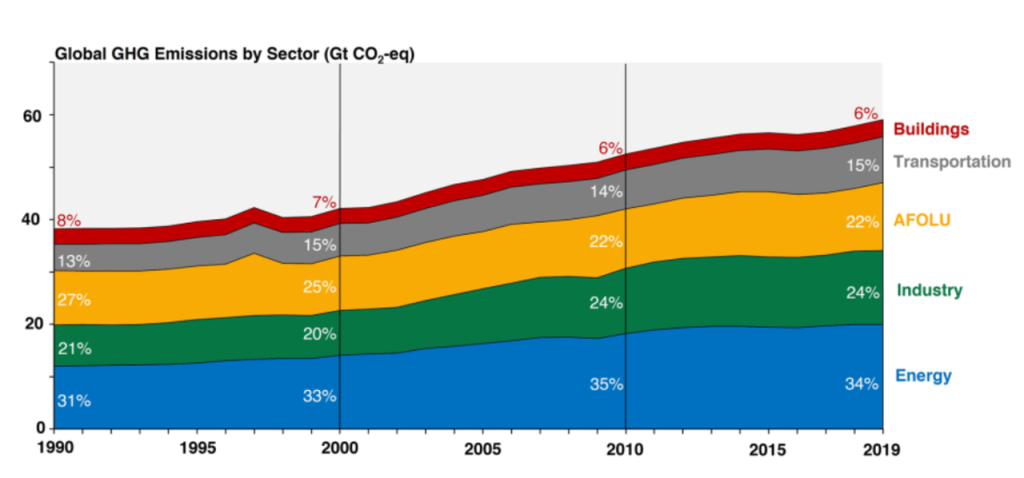
Figure 4. Recent increases in greenhouse gas emission by commercial sector. AFOLU represents agriculture, forestry, and other land uses including clearing of forests for livestock grazing. From https://www.epa.gov/ghgemissions/global-greenhouse-gas-overview. Data from the Working Group III report of the IPCC (2022).
Natural Sources of Greenhouse Gases
Just as traditional air pollutants can occur naturally, so can greenhouse gases. CO2 is, of course, a normal component of the atmosphere, produced by respiration, decomposition of dead plant and animal material, forest fires, volcanoes and weathering of rocks. Methane and N2O are produced by respiration and decomposition in wet environments. Methane is also produced by seepage from fossil fuels deposits, by digestion, especially by the group of herbivores called ruminants (including cows, sheep, and goats but also deer, antelope, and giraffe), and by melting of an ice-like form of methane, gas hydrate, found on the ocean floor and in permafrost.
Global-Warming Potentials
Greenhouse gases differ in their lifetime in the atmosphere and in their global-warming potentials (GWP). CO2 takes part in many atmospheric interactions and can disappear from the atmosphere in a few decades or persist for thousands of years; its lifetime in the atmosphere is not reported. It is the standard against which the global-warming potential of other gases are measured.
Methane is a relatively short-lived GHG, lasting approximately 12 years in the atmosphere. As a result of this shorter life, its global warming potential, relative to CO2, depends on the timeframe. Over a 20-year period, methane is approximately 80 times as effective as CO2 at warming the atmosphere. Most data presentations use a 100-year timeframe, and over that longer period, methane is approximately 28 times as effective as CO2.
Nitrous oxide is 273 times more effective than CO2 over a 100-year period, and has an approximately 100-year lifespan. Because of their higher warming potentials, methane and nitrous oxide are well worth regulating and reducing, despite their lower concentrations in the atmosphere. Some much less common gases are far more potent: sulfur hexafluoride (SF6), used in electrical and electronic applications, is 25,200 more potent than CO2 and lasts some 3,200 years in the atmosphere.
Changes in Reflectivity Affect How Much Energy Enters Earth’s System
Humans cannot affect how much sunlight reaches the outer atmosphere, but we can affect how much stays to warm the Earth. When sunlight energy reaches Earth, it can be reflected, thereby not warming the planet, or absorbed. The amount that is reflected or absorbed depends on Earth’s surface and atmosphere. Light-colored objects and surfaces, like snow and clouds, tend to reflect most sunlight, while darker objects and surfaces, like the ocean and forests, tend to absorb more sunlight. Albedo refers to the amount of solar radiation reflected from an object or surface, often expressed as a percentage. Earth as a whole has an albedo of about 30%, meaning that 70% of the sunlight that reaches the planet is absorbed. Sunlight that is absorbed warms Earth’s land, water, and atmosphere.
Albedo is also affected by aerosols. Aerosols are small particles or liquid droplets in the atmosphere that can absorb or reflect sunlight. Unlike greenhouse gases (GHGs), the climate effects of aerosols vary depending on what they are made of and where they are emitted. Those aerosols that reflect sunlight, such as particles from volcanic eruptions or sulfur emissions from burning coal, have a cooling effect. Those that absorb sunlight, such as black carbon (a part of soot), have a warming effect. Cleaning up sulfate air pollution, globally, decreased air pollution, but increased climate change because the loss of very reflective sulfate aerosol particles decreased the albedo of the atmosphere.
Natural changes in albedo, like the melting of sea ice or increases in cloud cover, have contributed to climate change in the past, often acting as feedback to other processes. Volcanoes have played a noticeable role in climate. Volcanic particles that reach the upper atmosphere can reflect enough sunlight back to space to cool the planet’s surface by a few tenths of a degree for several years. Volcanic particles from a single eruption do not produce long-term change because they remain in the atmosphere for much shorter times than GHGs.
Human changes in land use and land cover also have changed Earth’s albedo. Processes such as deforestation, reforestation, desertification, and urbanization often contribute to changes in climate in the places they occur. These effects may be significant regionally but are smaller when averaged over the entire globe.
Current Levels of Warming
The following information comes from the Berkeley Earth Global Temperature Report for 2024. Berkeley Earth is a nonprofit research group that collects and analyzes climate data and provides open-source information products of their findings.
The year 2024 began with six months of continuous record high monthly-average temperatures (Fig 5). This is partly due to the El Niño event that peaked in late 2023. However high temperatures persisted well beyond the end of El Niño in June 2024. Similar warmth occurred in the second half on 2024, though only August set a new record as the other five months each ranked behind the records set in 2023. In 2024, our analysis placed every month at least 1.5 °C (2.7 °F) above the 1850-1900 average for that month.
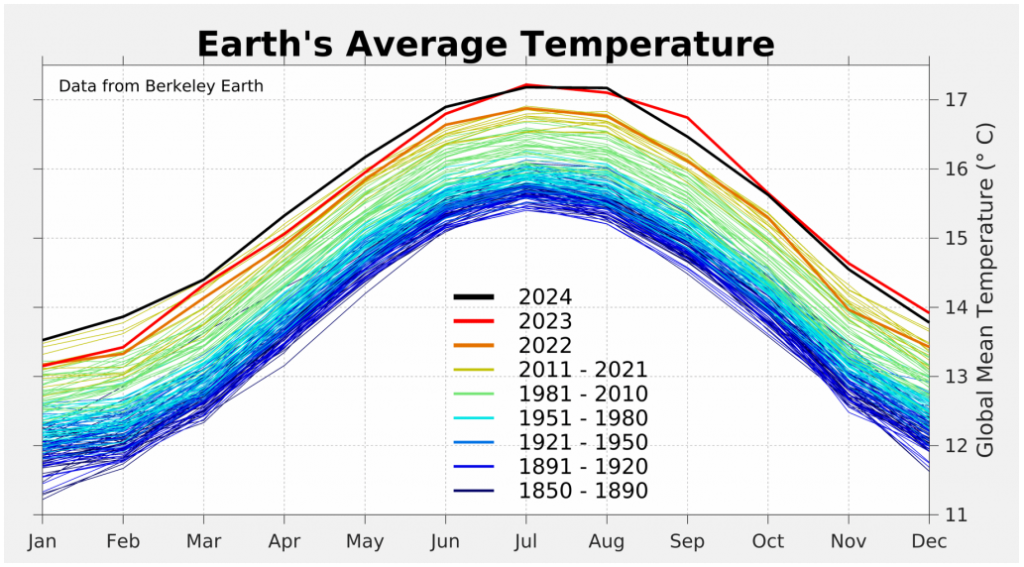
Figure 5. Global mean temperatures, by month, from 1850-2024. From Berkeley Earth Global Temperature Report for 2024.
The warming spike in 2023/2024 suggests that the past warming rate is no longer a reliable predictor of the future, and additional factors have created conditions for faster warming, at least in the short-term. Berkeley Earth Global Temperature Report for 2024
The warming pattern in 2023/2024 has been extraordinary. It appears to have been caused by a combination of natural and man-made factors.
While global warming controls the long-term trend, it changes only gradually. Short-term fluctuations in global mean temperature are primarily driven by internal variations in the climate system, such as the state of the El Niño / La Niña oscillation. To a lesser extent, they can also by affected by external processes such as the solar cycle and volcanic eruptions.
Though it is interesting to understand the characteristics of individual years, global warming is ultimately about the long-term evolution of Earth’s climate. The exceptional nature of the warming in 2023/2024 makes future forecasting more difficult, since it likely points to a deviation from the historical trend.
Since 1980, the overall trend has been about +0.20°C/decade (+0.36°F/decade). The extreme warmth in 2023/2024 likely points to a period of greater warming. However, whether that greater warming rate persists over the long-term or is only present briefly is hard to predict. To the extent that excess recent warming is likely driven by reductions in man-made aerosol pollution (mostly sulfate aerosols, as mentioned above), future warming from this source will also depend directly on human choices regarding the regulation of such aerosols.
That said, our long-term trend estimate (a 30-year window) has already crossed 1.4°C (2.5°F) above the average temperature from 1850-1900. Given recent rates of warming is may take only ~5 years for our long-term trend to reach 1.5°C (2.7°F).
The Paris Agreement on Climate Change aims to keep the long-term average global temperature rise to well below 2°C (3.6°F) and encourages parties to strive for warming of no more than 1.5°C (2.7°F). It has been clear for sometime that the 1.5°C (2.7°F) goal will not be achieved. Too little time remains and efforts at mitigation fall far short of what would have been needed to meet that target.
Nonetheless, effective mitigation can still limit global warming and reduce the severity of negative outcomes. The increasing abundance of greenhouse gases in the atmosphere due to human activities is the primary cause of recent global warming. If the Paris Agreement’s goal of no more than 2°C (3.6°F) warming is to be reached, significant progress towards reducing greenhouse gas emissions needs to be made soon.
Jonathan Röckstrom, an environmental scientist who has been deeply involved with planetary boundary and climate change research presented a TED talk in 2024 on The Tipping Points of Climate Change – and Where We Stand, which you can view here.
Feedback Loops, Tipping Points, Thresholds, and Climate Change
Past and Present-day GHG Emissions Will Affect Climate Far into the Future
Many greenhouse gases stay in the atmosphere for long periods of time. Researchers presently believe that if we were to cease all anthropogenic GHG emissions, temperatures would level off in a few decades. But a return to pre-industrial temperatures will require many centuries. Partly this is due to the lifetime of greenhouse gases in the atmosphere, but CO2 and heat have also been absorbed by the ocean, including the deep ocean, and all of that must be purged to return the planet to pre-industrial temperatures.
https://climate.mit.edu/ask-mit/how-long-will-it-take-temperatures-stop-rising-or-return-normal-if-we-stop-emitting
Future Temperature Changes
The primary authority on climate change is the Intergovernmental Panel on Climate Change (IPCC), which issues large, complex assessments of climate change every 5-7 years. The most recent report , the 6th, often referred to as AR6, was issued in 2023. In order to estimate future climate change, the IPCC uses a range of scenarios from the lowest, SSP1.9, in which emissions are reduced very quickly to the highest, SSP 8.5, in which emissions continue to rise throughout the 21st century. SSP stands for shared socio-economic pathway and the numbers represent the force of warming, or radiative forcing, in Watts per square meter.
The summary of policy makers for the synthesis volume of the 2023 report provides the following summary of estimated future warming. The figure of 1.5°C (2.7°F) represents a level of warming that nations have agreed to work to avoid – an increase that represents clear risks, but less severe risks than under 2°C or higher warming. In 2024, the average planetary temperature broke the 1.5°C mark, but longer-term planetary averages are still below that level. Note that the IPCC report is based on data through approximately 2022. It did not include the 2023 and 2024 data that are discussed in the section above, on current levels of warming.
Global warming will continue to increase in the near term (2021–2040) mainly due to increased cumulative CO2 emissions in nearly all considered scenarios and modelled pathways. In the near term, global warming is more likely than not to reach 1.5°C even under the very low GHG-emission scenario (SSP1.9) and likely or very likely to exceed 1.5°C under higher emissions scenarios. In the considered scenarios and modelled pathways, the best estimates of the time when the level of global warming of 1.5°C is reached lie in the near term. Global warming declines back to below 1.5°C by the end of the 21st century in some scenarios and modelled pathways. The assessed climate response to GHG-emissions scenarios results in a best estimate of warming for 2081–2100 that spans a range from 1.4°C for a very low GHG-emissions scenario (SSP1.9) to 2.7°C for an intermediate GHG-emissions scenario (SSP4.5) and 4.4°C for a very high GHG-emissions scenario (SSP8.5). Climate Change 2023 Synthesis Report Summary for Policymakers.
Aspects of Climate Change Beyond Global Warming – Future Precipitation and Storm Events
Patterns of precipitation and storm events, including rain, snowfall, and frequency and intensity of tornadoes and cyclones are already changing due to global warming (in the meteorological world, thunderstorms and tornados are smaller, land-based storms, whereas cyclones are larger storms that arise over oceans and include hurricanes and typhoons). The nature of these changes in the future is generally less certain than the changes associated with temperature because they involve more complicated climate mechanisms.
For example, increasing temperatures warm the oceans and land, increasing evaporation and creating conditions that give rise to thunderstorms, tornadoes, and cyclones. However, increasing temperatures also change winds in ways that can make it harder for the vortexes that drive such storms to build to the heights that create severe storms. Current predictions suggest cyclones will increase in intensity, but perhaps not in frequency, and may travel further towards the poles than in the past (because warmer waters will support their growth and travel). In January, 2025, a storm with hurricane-force winds struck Anchorage, Alaska, in the US. January 2025 was the warmest January on record, globally.
Due to increased evaporation, average precipitation is expected to increase, but a number of presently dry areas are predicted to become drier (including the American Southwest, southern Africa, the Mediterranean, and the Caribbean); in these areas, although precipitation may increase, evaporation will increase more. In addition to change in precipitation, timing of precipitation is expected to change, with more precipitation falling outside of the growing season in temperate latitudes, and more intense precipitation occurring, generally, which increase risk of crop damage, catastrophic erosion, and flooding. Formerly predictable precipitation patterns such as the African and Asian monsoons have already become much less predictable.
Due to warming, more precipitation will fall as rain in areas that once received snow. Snowpack holds water for longer periods, releasing it more slowly, and watering mountains and their streams over an extended period of time. A change to rain means a longer dry period both for mountains and for extensive downstream areas that rely on montane water delivery.
Although the general pattern of warming is quite consistent around the planet, frequency and severity of heat waves are also increasing. Night-time temperatures are higher because the increased heat-absorbing properties of the atmosphere mean that at night, when the sun is not heating the dark side of the planet, heat is retained was radiated to space under lower levels of GHGs. In some areas, cold extremes may also occur. Global warming has weakened the winds, called a polar vortex, that once confined the Arctic cold-air mass more tightly to the Arctic. As the winds weaken, their course becomes more erratic, allowing Arctic air to come further south more often than it once did, causing severe winter cold that can last for several days or more.
Climate-change impacts will be discussed in most of the remaining chapters, as the impacts related to the specific chapter topics.
NASA. Climate Change. Website.
Media Attributions
- co2 over 800000 years to 2023
- GHG increases over time by gas type
- global GHG by sector
- 2023 and 2024 temperatures by month.BerkeleyEarth
