
Trends in Levels of Traditional Air Pollutants
US Trends
The graphs below show trends in the US criteria air pollutants relative to the national standards and in terms of mass; of these pollutants, only PM2.5, fine particulates, shows signs of increasing, and all are below the current national standard (Figs 4, 5).
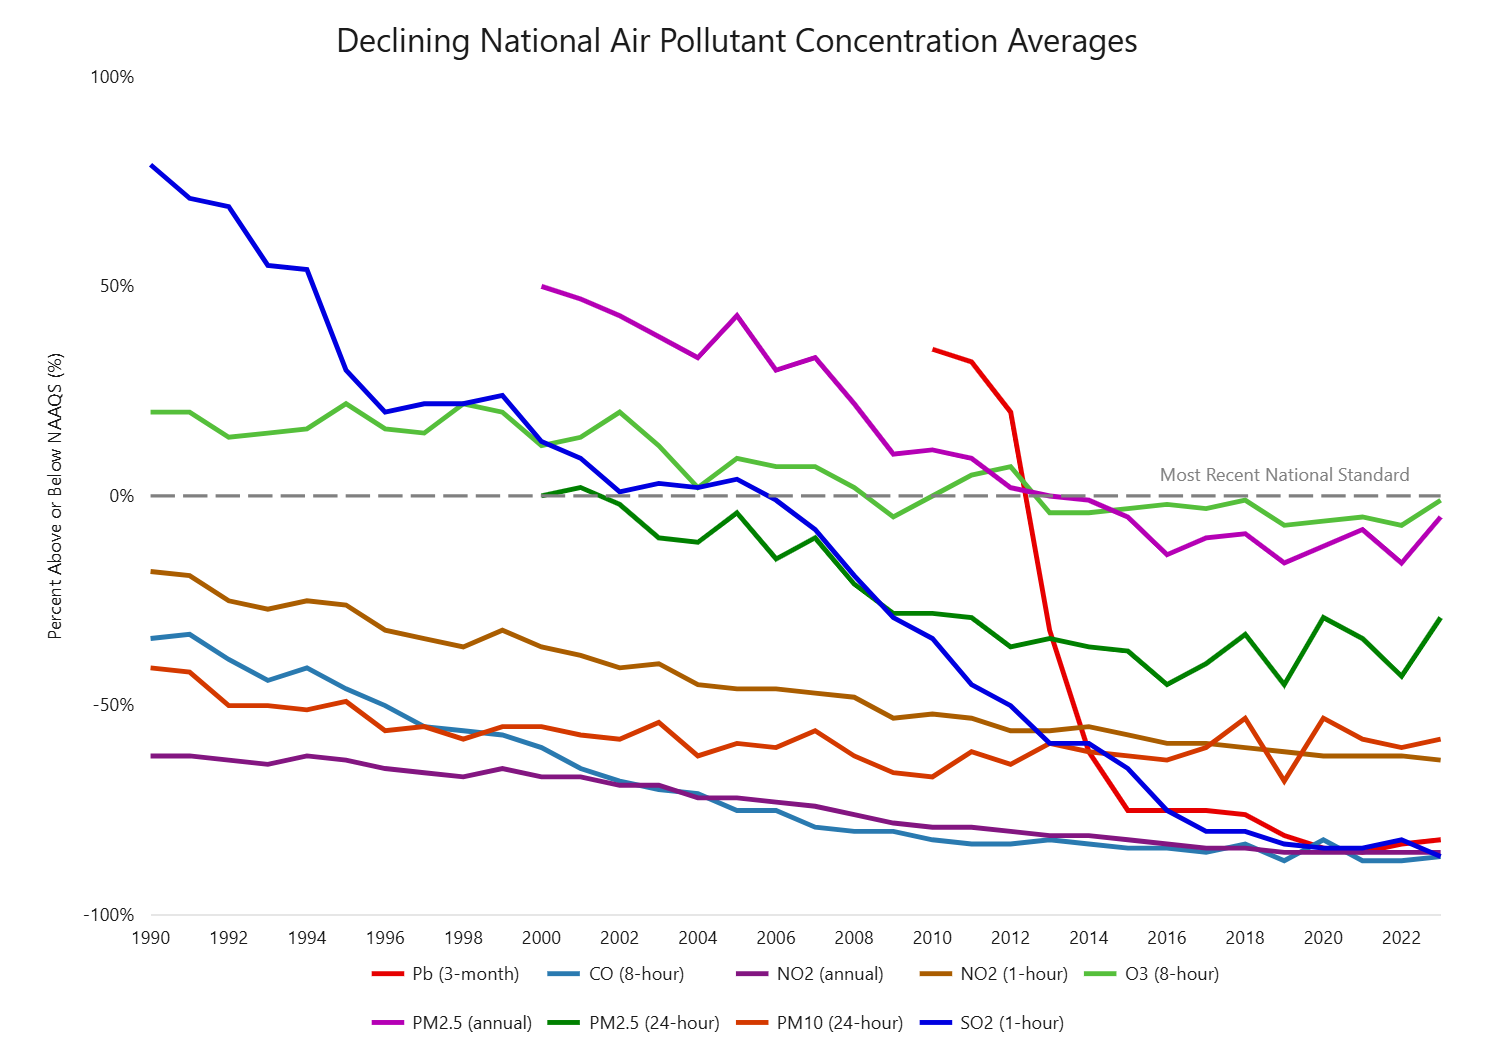 Figure 4. Trends in US criteria air pollutants, relative to the national standards.
Nationally, concentrations of air pollutants have dropped significantly since 1990:
- Carbon Monoxide (CO) 8-Hour, down 79%
- Lead (Pb) 3-Month Average, down 87% (from 2010)
- Nitrogen Dioxide (NO2) Annual, down 62%
- Nitrogen Dioxide (NO2) 1-Hour, down 55%
- Ozone (O3) 8-Hour, down 18%
- Particulate Matter 10 microns (PM10) 24-Hour, down 29%
- Particulate Matter 2.5 microns (PM2.5) Annual, down 37% (from 2000)
- Particulate Matter 2.5 microns (PM2.5) 24-Hour, down 29% (from 2000)
- Sulfur Dioxide (SO2) 1-Hour, down 92%
- Numerous hazardous air pollutants, or air toxics, have declined with percentages varying by pollutant
Despite increases in air concentrations of pollutants associated with fires (carbon monoxide, particle pollution, and ozone), national average air quality concentrations remain below the current, national standards.
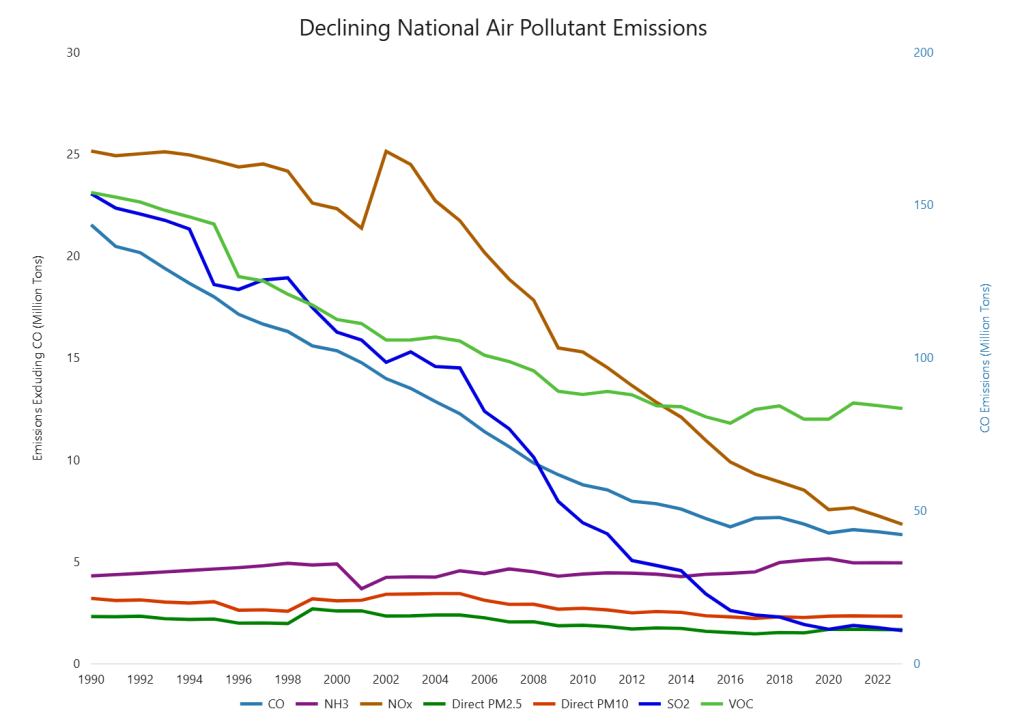
Figure 5. Trends in US air pollutants by weight.
Emissions of most key air pollutants continue to decline from 1990 levels:
- Carbon Monoxide (CO), down 71%
- Ammonia (NH3), up 15%
- Nitrogen Oxides (NOx), down 73%
- Direct Particulate Matter 2.5 microns (PM2.5), down 28%
- Direct Particulate Matter 10 microns (PM10), down 27%
- Sulfur Dioxide (SO2), down 93%
- Volatile Organic Compounds (VOC), down 46%
In addition, from 1990 to 2017 emissions of air toxics declined by 74 percent, largely driven by federal and state implementation of stationary and mobile source regulations, and technological advancements from American innovators.
Global Trends
Worldwide, mortality associated with air pollution is declining (Fig 6). But international progress in reducing air pollution varies considerably by region.
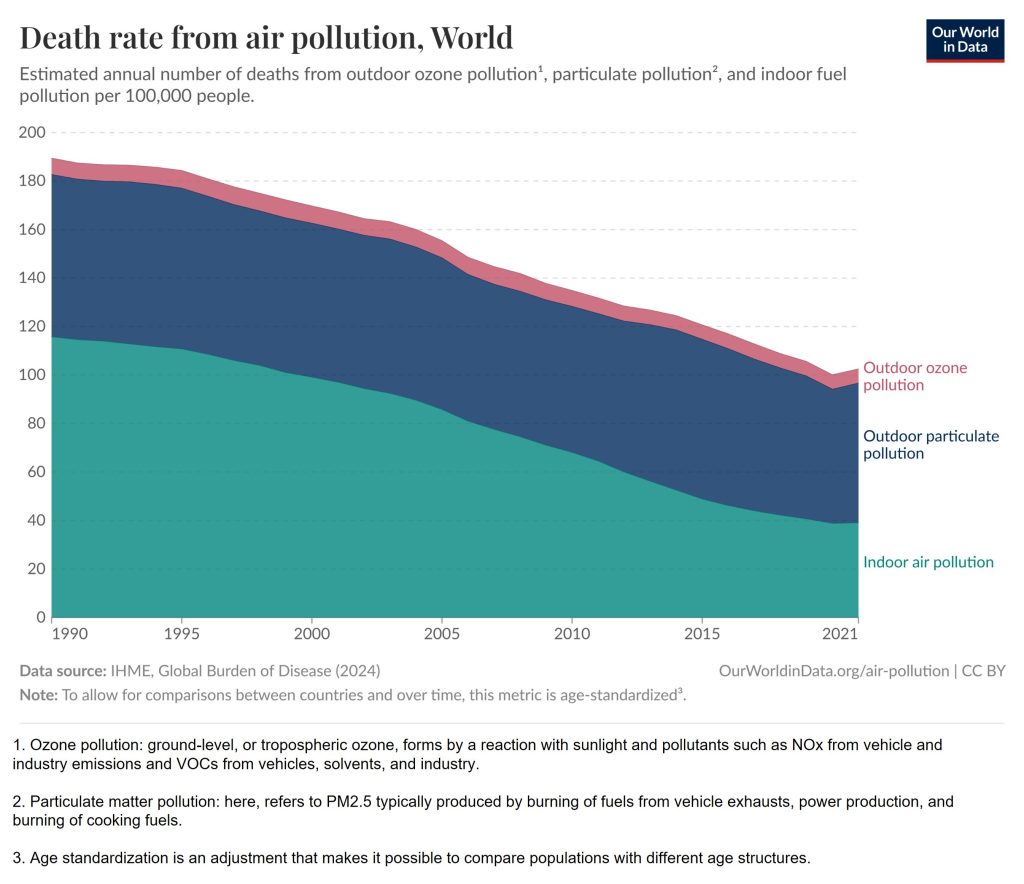
Figure 6. Global trends in deaths caused by air pollution, by type of air pollution.
At present, the most polluted cities (Fig 7) and countries are concentrated in Southeast Asia and Africa, but instances of poor air quality can be found much more widely. Within regions, air temperature, weather, agricultural activity, home heating, and local phenomena such as wildfires and dust storms can cause seasonal changes in air pollution, as well. Temperature inversions can trap air in valleys, or in cold, surface air layers in winter, concentrating local pollutants for several days at a time and significantly increasing pollution concentrations and resulting health impacts.
International air-quality rankings such as those shown in Figure 7 may rely solely on measurements of PM2.5, which are easy and inexpensive to obtain. Nations have not agreed upon an international air-quality index, but international reporting of useful component measurements is becoming more common. Although measurements are not universally available for all the major air pollutants, observations such as the improvements in the ozone hole, and reduction in acid rain provide evidence of the global trends in some air pollutants.
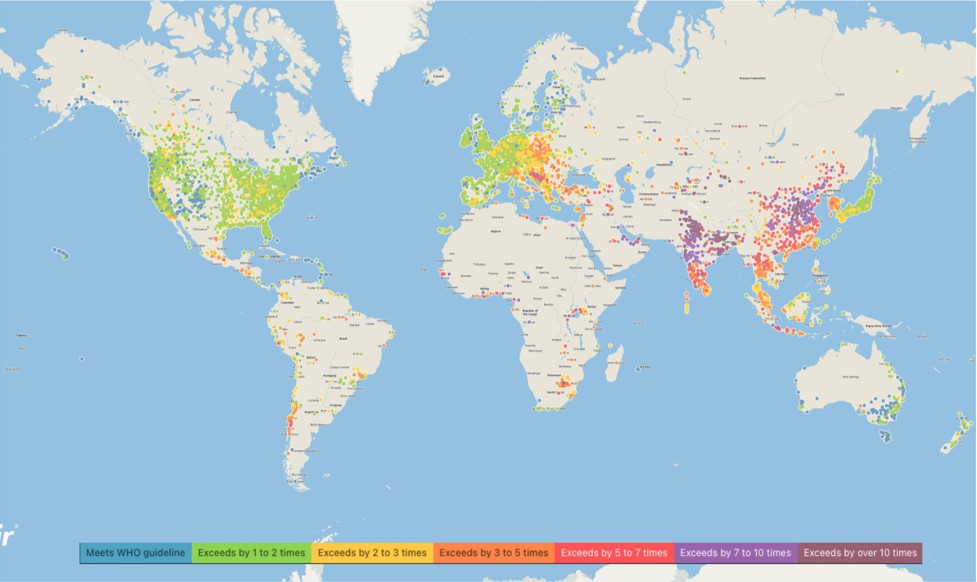
Figure 7. City measurements of PM2.5 relative to the WHO guidelines. From https://www.iqair.com/us/world-air-quality-report?srsltid=AfmBOoqow9aUqZGKjIxS4H0VXcaPAULuuUtYlOKJ4oApf5oAkMoN0EC0
Control Techniques for Traditional Air Pollution
Air-pollution control is achieved by modifying processes that produce air pollutants and by cleaning dirty air. Reductions in use of fossil fuels have reduced CO2, CO, NOx, SO2, ground-level ozone, and particulates. Changes to refrigerants, construction materials and home furnishings have reduced levels of VOCs and chemicals that harm the stratospheric ozone level. Restoration to repair degraded land can reduce dust (particulates). At mining sites, roads may be wetted daily or more often to reduce dust, where control is required. Cover crops can reduce dust from fallow agricultural lands.
Air-pollution control technologies to reduce particulates in industry and transportation use static electricity, strong air currents, protective bags, and filters to capture the particles where they are produced. Scrubbers use liquid or treated surfaces (activated charcoal is an example) to wash out or trap polluting chemicals from flue-gas stacks (“smoke stacks”). Air-polluting substances can also be oxidized – burned – at high temperatures, often using catalysts to reduce the heat needed to destroy the pollutants.
Effectiveness of air pollution control has varied among air pollutants, even in developed countries with strong laws to protect air quality. The differences between reductions in SO2 and reductions in NOx demonstrate some of the issues involved. Both pollutants result primarily from burning of fossil fuels, but SO2 originates more from stationary industrial sources and less from mobile vehicular sources than NOx (Fig 2). Scrubbers and similar technology used to remove pollutants from flue-gas stacks work more effectively on SO2 than on NOx and sulfur compounds are much cheaper to remove from gasoline than nitrogen compounds. Increases in numbers of vehicles on the road and in number of miles driven further increase NOx emissions in many countries. Air pollution control of both these emissions has resulted in substantial declines in acid rain – one of the primary effects of both pollutants – but whereas the EPA reported a 92% drop in SO2 between 1990 and 2023, NOx levels in the same period declined by 55% (Fig 3, 1-hour standards).
Air Pollution Policies and Standards
US Air Pollution Regulation
In the US, criteria air pollutants are regulated by the Clean Air Act (CAA), as are toxic air pollutants and pollutants that harm the stratospheric ozone level. The Environmental Protection Agency is tasked with implementing the Clean Air Act, which includes permitting of major sources and some area sources of air pollution, requirements for air-pollution control technology used to reduce air pollution at major sources, and limits on the levels of certain chemicals in products such as construction materials, solvents, paints, etc. that can contribute to air pollution.
The EPA sets National Ambient Air Quality Standards (NAAQS) for each criteria air pollutant. State agencies responsible for air quality develop State Implementation Plans to indicate how they will stay within the standards, and monitor pollutants to ensure standards are met. Areas that exceed the NAAQS are labeled non-attainment areas; state and local agencies that manage air quality are required to develop plans to bring non-attainment areas into compliance with NAAQs.
Major new stationary sources of air pollution must meet high standards of pollution control technology in order to obtain permits to emit air pollution, particularly if they will be built in non-attainment areas. Manufacturers of new chemicals that may be air pollutants are required, under the Toxic Substance Control Act (TOSCA) to notify EPA about new chemicals or new uses of existing chemicals that may contribute to air pollution. If the EPA finds that new chemicals or new uses pose unreasonable threats to human or environmental health, the agency can require additional testing to provide further information, and can impose restriction on use.
International Air Pollution Regulation
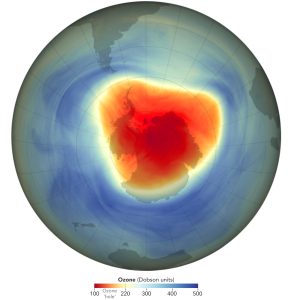
Figure X. The ozone layer on 28 September, 2024, showing strong thinning over the South Pole. Scientists predict the hole could close by 2066. https://earthobservatory.nasa.gov/images/153523/ozone-hole-continues-healing-in-2024
International treaties cover some air pollutants, particularly pollutants that are harmful to stratospheric ozone – that contribute to the “ozone hole” (Fig X). The Montreal Protocol on on Substances That Deplete the Ozone Layer (1987; usually simply the Montreal Protocol) was a binding implementation agreement that grew out of the Vienna Convention on the Protection of the Ozone Layer (1985). It was the first of only a handful of UN treaties to achieve ratification by all nations, and has been called the most successful environmental agreement. The Protocol sets limits on production and use of chemicals that have been found to be harmful to the stratospheric ozone layer that protects life on Earth from harmful UV radiation. Most of these chemicals are early refrigerants, aerosols, and related chemicals – chlorofluorocarbons (CFCs) and hydrofluorocarbons (HFCs) – but the list of controlled chemicals is updated regularly to ensure ongoing protection of the ozone layer. The Protocol includes a so-called “ratcheting” mechanism that decreases allowable emissions over time – an important reason for its success.
Ozone thinning continued to worsen during the early years of implementation of the Montreal Protocol, with the largest thinned area occurring in the 2000s – 28.4 million square kilometers or more than 4 times the size of the US. In 2024, the maximum extent of the ozone hole was 21.9 million square kilometers – still a significant proportion of the all-time maximum. Nevertheless, the Protocol has led to reductions of emissions of ozone-depleting substances by more than 99% and production of many of them has ceased. Scientists now predict that the ozone hole could “heal” completely well before the end of the century.
An earlier, and less heralded air pollution treaty, the 1979 Convention on Long-Range Transboundary Air Pollution paved the way for the Montreal Protocol. It was the first multilateral agreement to address the problem of air pollution crossing international boundaries, and allowed Europe, Russia, and North America to work together to understand and reduce long-range air pollution. It not only reduced air pollution emissions as intended but also began the process of uncoupling air pollution from economic growth, and important step for better air quality in the long term. https://www.state.gov/key-topics-office-of-environmental-quality-and-transboundary-issues/convention-on-long-range-transboundary-air-pollution/
Not all air pollution treaties involve many nations. The US-Canada Air Quality Agreement (1991) is a binational treaty, similar to the Convention on Long-Range Transboundary Air Pollution, to address air pollutants that contribute to acid rain and smog. By 2007, both nations had met the main requirement of the treaty, and a 2023 review and assessment (ECCC & USEPA 2023) recommended updating the agreement to develop and implement strategies for additional air pollutants such as PM2.5.
National air pollution standards very widely among the nations of the world, due, in part, to technological capacity. Whereas Figure 5 demonstrates observed levels of PM2.5 around the world, Figure Y shows the standards set by nations for PM2.5. Because pollutants are not measured uniformly, comparing national standards and national pollution levels ranges can be difficult. For example, Figure Y shows the PM2.5 standard for a 1-year averaging period; a map of the PM2.5 standards for a 24-hour averaging period would rank nations differently. WHO guidelines are available for both measurement frameworks, which allows comparison to a standard, but comparisons between countries can vary depending on the specific measurement. Similarly, observed pollution levels may be measured with different instrumentation, at different elevations off the ground, with different densities of measurements, at different time intervals, etc.
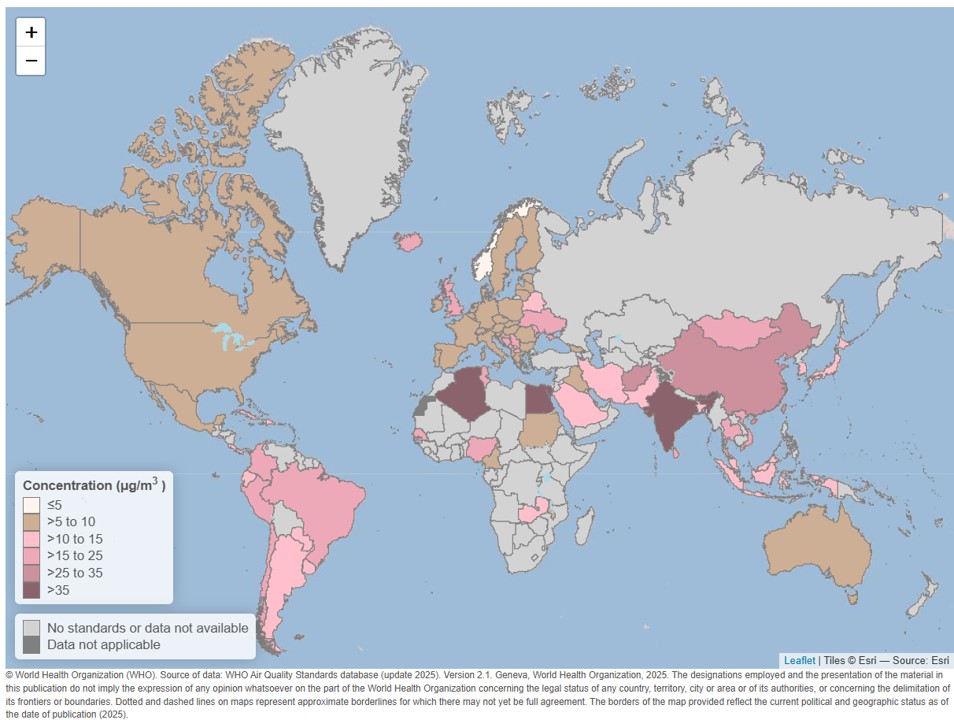
Figure Y. PM2.5 standards for nations around the world, 2025, for a one-year averaging period. Note that the WHO guideline for PM2.5 is 5 μg/m3 in that timeframe. https://worldhealthorg.shinyapps.io/Air_Quality_Standards_V2_1/
Regulation and Control of Greenhouse Gases
The UN Framework Convention on Climate Change (UNFCCC; 1992) was the first international treaty to address greenhouse gas (GHG) emissions that cause global warming. The Paris Agreement, adopted in 2015, built on the UNFCCC to create a binding agreement requiring nations to set firm goals (nationally determined contributions: NDCs) to reduce GHG emissions. Like the Montreal Protocol, it has a ratcheting mechanism that requires nations to be more and more ambitious in their reductions over time. However, the Paris Agreement has not enjoyed the success of the Montreal Protocol; emissions of GHGs continue to increase.
Developed countries bear most of the blame for the lack of progress: the US and the European Union are the 2nd and 4th greatest emitters and have the technology and the greater economic stability needed to undertake deep cuts, and have not done so. Since 2025, the US is not even participating in the treaty – the only major emitter to withdraw from the Agreement (twice – the US withdrew from 2017-2021, as well). The Paris Agreement explicitly encourages developed countries to lead emissions reductions. It acknowledges that transitional and developing countries need time to balance decreased emissions with economic growth. Emissions from China (the largest emitter by a considerable margin) and India (3rd greatest emitter) demonstrate the air-quality outcomes of a slower transition to clean energy. China now produces more GHGs than the developed countries, combined. Further, while national goals of developed, transitional, and developing countries are insufficient to reduce warming, policies and actions typically lag behind national goals, worsening the outlook for success.
Bibliography for emitter order: Crippa, M., Guizzardi, D., Pagani, F., Banja, M., Muntean, M., Schaaf, E., Monforti-Ferrario, F., Becker, W.E., Quadrelli, R., Risquez Martin, A., Taghavi-Moharamli, P., Köykkä, J., Grassi, G., Rossi, S., Melo, J., Oom, D., Branco, A., San-Miguel, J., Manca, G., Pisoni, E., Vignati, E. and Pekar, F., GHG emissions of all world countries, Publications Office of the European Union, Luxembourg, 2024, doi:10.2760/4002897, JRC138862 https://edgar.jrc.ec.europa.eu/report_2024
Media Attributions
- naaqs-concentrations-averages-data (1)
- naaqs-emissions-totals-data (1)
- death-rates-from-air-pollution.ourworldindata
- 2024 PM2.5 concentrations by city.IQair
- ozone_geos5_20240928_lrg.NASA
- Worldwide PM2.5 standards.WHO.
Usually, air is cooler at higher elevations, as you may experience when traveling in mountains. A temperature inversion occurs when a warm air mass settles over a cold air mass. During an inversion, air pollutants created near the ground cannot rise to higher elevations and be dispersed by winds.
Cover crops are crops grown to maintain ground cover when the main food crop is not being grown - usually during the period between fall harvest and spring planting, during cold or dry seasons. Most cover crops do not provide food, but they protect the land from erosion and help to maintain healthy soil by keeping a root system in the ground. Cover crops may be killed by mechanical damage or poison before the food crop emerges.
In chemistry, a catalyst is a chemical that does not participate in a reaction but helps to increase the rate of the reaction or reduce the amount of energy necessary to achieve the reaction. Under perfect conditions, the catalyst is completely unchanged during this process. In practice, catalysts (like the platinum in an automobile catalytic converter) need to be replaced, at intervals.
