
3.4 Water Pollution Trends and Control
Trends in the US
In the 1960s, some rivers in the US carried so much pollution that it was possible for them to be on fire. Many of the industrial wastes in water of that period have been significantly reduced, but a constant stream of new chemicals, many of them persistent in the environment and difficult to treat, is being produced, and some kinds of wastes, such as heavy metals, continue to be a problem. Clean-up is further complicated because, for many pollutants, no safe levels exist – to render drinking water safe and to protect water quality in rivers and lakes to protect aquatic ecosystems, these materials should be entirely removed, which is likely impossible.
Under the Clean Water Act of 1972, pollutant means “dredged spoil, solid waste, incinerator residue, sewage, garbage, sewage sludge, munitions, chemical wastes, biological materials, radioactive materials, heat, wrecked or discarded equipment, rock, sand, cellar dirt and industrial, municipal, and agricultural waste discharged into water.” Such a comprehensive definition makes for challenging enforcement.
Drinking Water
The USEPA is charged with enforcing most US water-quality laws. The agency issues an annual Report on the Environment that provides information on aspects of air quality, water quality, land, condition, human health, and ecological condition. The following information is from the 2022 report section on drinking water.
Community water systems (CWS) are public water systems that supply water to the same population year-round. In fiscal year (FY) 2021, more than 315 million Americans (U.S. EPA, 2021)—roughly 95 percent of the U.S. population (U.S. Census Bureau, 2021)—got at least some of their drinking water from a CWS. This indicator [the EPA indicator for drinking water] presents the percentage of Americans served by CWS for which states reported no violations of EPA health-based standards for more than 90 contaminants (U.S. EPA, 2022a).
Health-based standards include Maximum Contaminant Levels (MCLs), Maximum Residual Disinfection Levels (MRDLs), and Treatment Techniques (TTs). An MCL is the highest level of a contaminant that is allowed in drinking water. An MRDL is the highest level of a disinfectant allowed in drinking water (U.S. EPA, 2022c). A TT is an enforceable procedure or level of technological performance which public water systems must follow to ensure control of a contaminant (U.S. EPA, 2022b). TTs are adopted where it is not economically or technologically feasible to ascertain the level of a contaminant, such as microbes, where even single organisms that occur unpredictably or episodically can cause adverse health effects. Compliance with TTs may require a variety of actions to protect public health, such as assessment of the system, filtration and disinfection, and optimized corrosion control (U.S. EPA, 2022b).
This indicator tracks the population served by CWS for which no violations of health-based standards were reported to EPA annually for the period from FY 1993 to FY 2021, the latest year for which data are available. Results are reported as a percentage of the overall population served by CWS, both nationally and by EPA Region. This indicator also reports the number of persons served by systems with reported violations of standards covering surface water treatment, microbial contaminants (microorganisms that can cause disease), disinfection byproducts (chemicals that may form when disinfectants, such as chlorine, react with naturally occurring materials in water and may pose health risks), and other contaminants. The indicator is based on violations reported quarterly by EPA, states, territories, and the Navajo Nation, who each review monitoring results for the CWS that they oversee.
Of the population served by CWS nationally, the percentage served by systems for which no health-based violations were reported for the entire year increased overall from 79 percent in 1993 to 92 percent in FY 2021 (Fig 1). Drinking water regulations have changed in recent years. This indicator is based on reported violations of the standards in effect in any given year.
When results are broken down by EPA Region, some variability over time is evident (Fig 2). Between FY 1998 and FY 2021, most Regions were consistently above the national percentage. Only Region 2 remained consistently below the national percentage over the entire period of record, largely because of a small number of public water systems serving large populations.
In FY 2021, reported violations involving surface water treatment rules were responsible for exceeding health-based standards for 15.6 million people (4.9 percent of the population served by CWS nationally). Reported violations of the health-based disinfection byproducts rules affected 4.3 million people (1.4 percent of the CWS-served population).
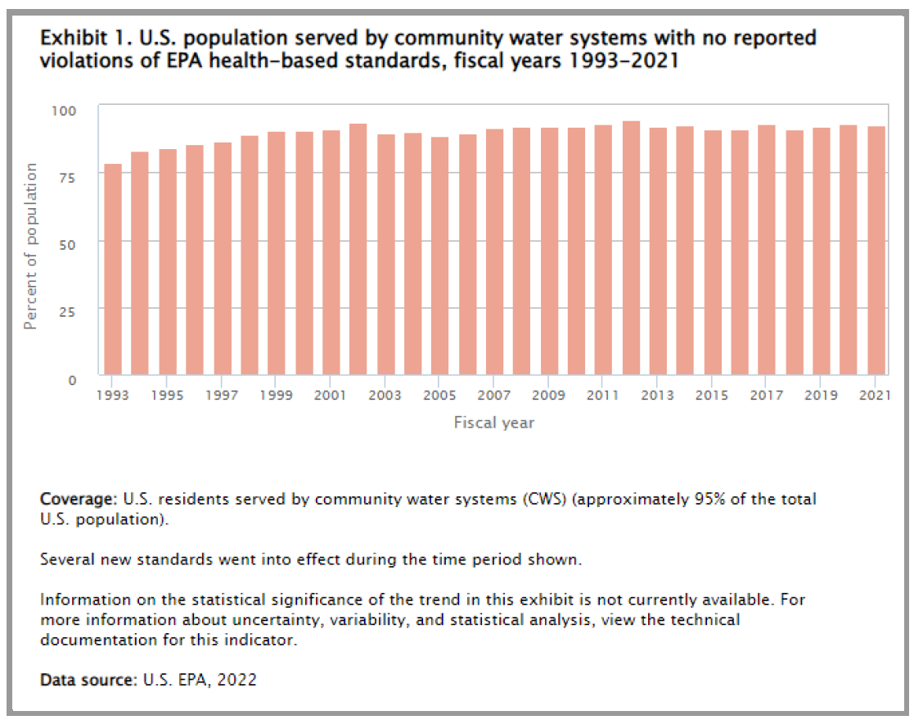
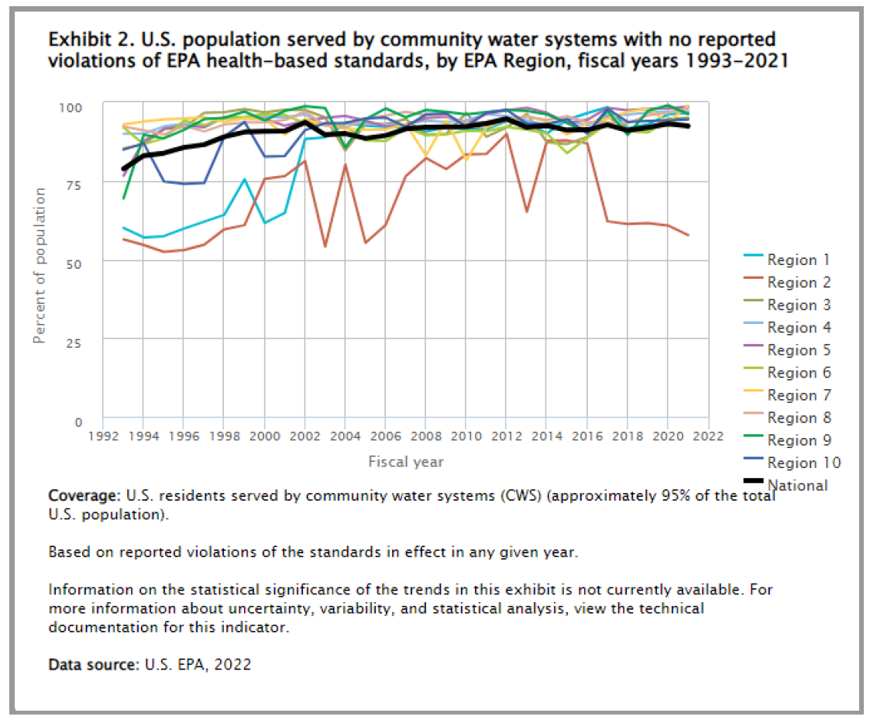
Figure 1. Proportion of the US population that is served by community water systems Figure 2. Proportion of the US population that is served by community water systems that reported no violations of EPA health-based standards. that reported no violations of EPA health-based standards, broken down by EPA region.
EPA Region 1, shown by the turquoise line in Figure 2, comprises the New England states: Maine, Vermont, New Hampshire, Massachusetts, Connecticut, and Rhode Island. Region 2, the rust-colored line in Figure 2, comprises New York and New Jersey.
Households that do not get water from community water systems are largely on private wells (groundwater) or take water directly from rivers or lakes (surface water).
Trends in surface water
National and global information on specific water pollutants is less easy to obtain than information in air pollutants. Whereas air pollution is somewhat well mixed, at least at the level of cities, water pollution varies considerably among bodies of water and with distance from sources of pollution. Air pollution may also be easier and less expensive to measure. In addition, whereas treatment for air pollution tends to be controlled before the pollutant is discharged into the air, water pollution is controlled at two levels; it is regulated by permit before it is discharged into bodies of water, but is also treated when water is withdrawn from surface or ground water, before it is used for municipal or industrial use. Air pollution regulations seek to make air safe to breathe, but water pollution regulations need not make surface or groundwater safe to drink.
Under EPA regulations, states set water quality standards, depending on the major uses of water bodies (e.g., drinking water, fishing, industrial, recreational). Water bodies with measurements exceeding the standards are considered to be impaired. Figure 3 shows a map of impaired waters – bodies of water found to have exceeded at least water quality standard, of 2015.
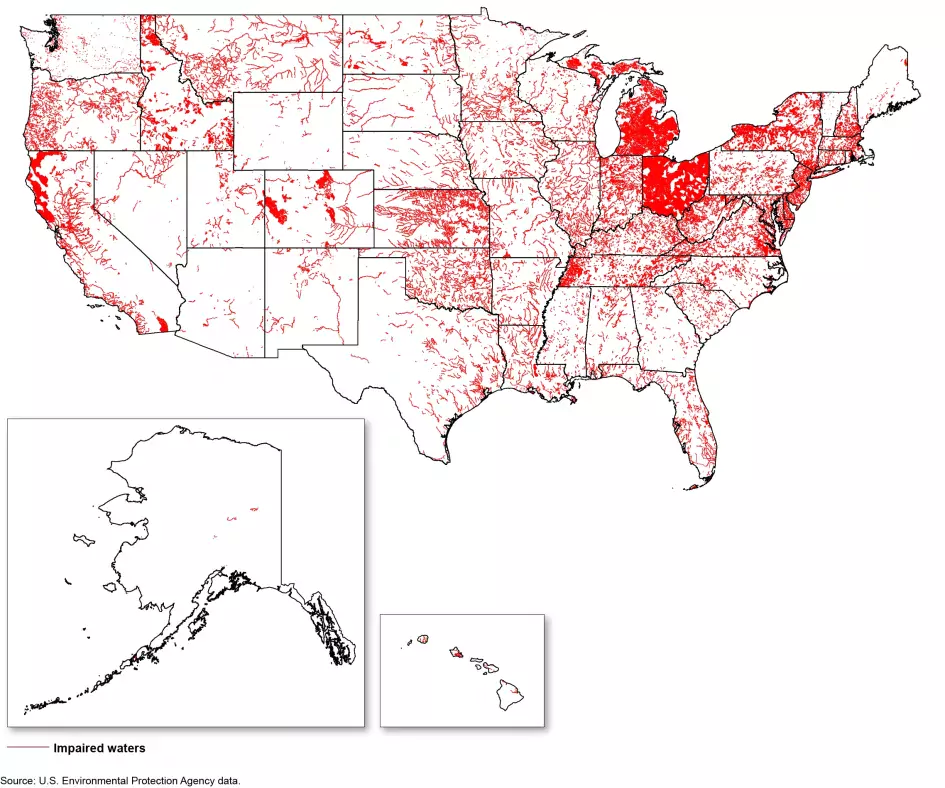
Figure 3. Waters of the US found to be impaired as of 2015.
introduce how nutrients are managed. The EPA estimates that 44% of rivers and streams, 50% of lakes and 17% of coastal waters have nutrient levels above recommended values, with only about half of the relevant water bodies having been assessed, as of 2017.
One indirect measure of nutrient pollution from the Midwest, where the majority of high-intensity agriculture occurs, is the size of the “dead zone” in the Gulf of Mexico. Because the Mississippi drains the Missouri and the Ohio, in addition to its own flow, it encompasses 41% of the contiguous US (the US excluding Alaska and Hawai’i) and most of the high-intensity agricultural area. As a result, it collects the nutrient pollution of that region, which then is deposited into the northern coastal region of the Gulf. The nitrogen and phosphorus trigger algal blooms that then rapidly decompose. The bacterial decomposers exhaust the oxygen supply in the region, creating a large hypoxic zone that is deadly to much marine life – hence “dead zone” (Fig 4). The size of the dead zone varies depending on the winter and spring precipitation regime in the basin including the storm history and resulting erosion. Once crops begin to grow and bacteria become more active, in late spring, nutrient run-off lessens. The size of the hypoxic zone is mapped each year, providing evidence of the ongoing problem with nutrient pollution. The dead zone affects marine ecosystem health in the region as well as human health and economic health of the Gulf states, due to loss of fisheries and recreation.
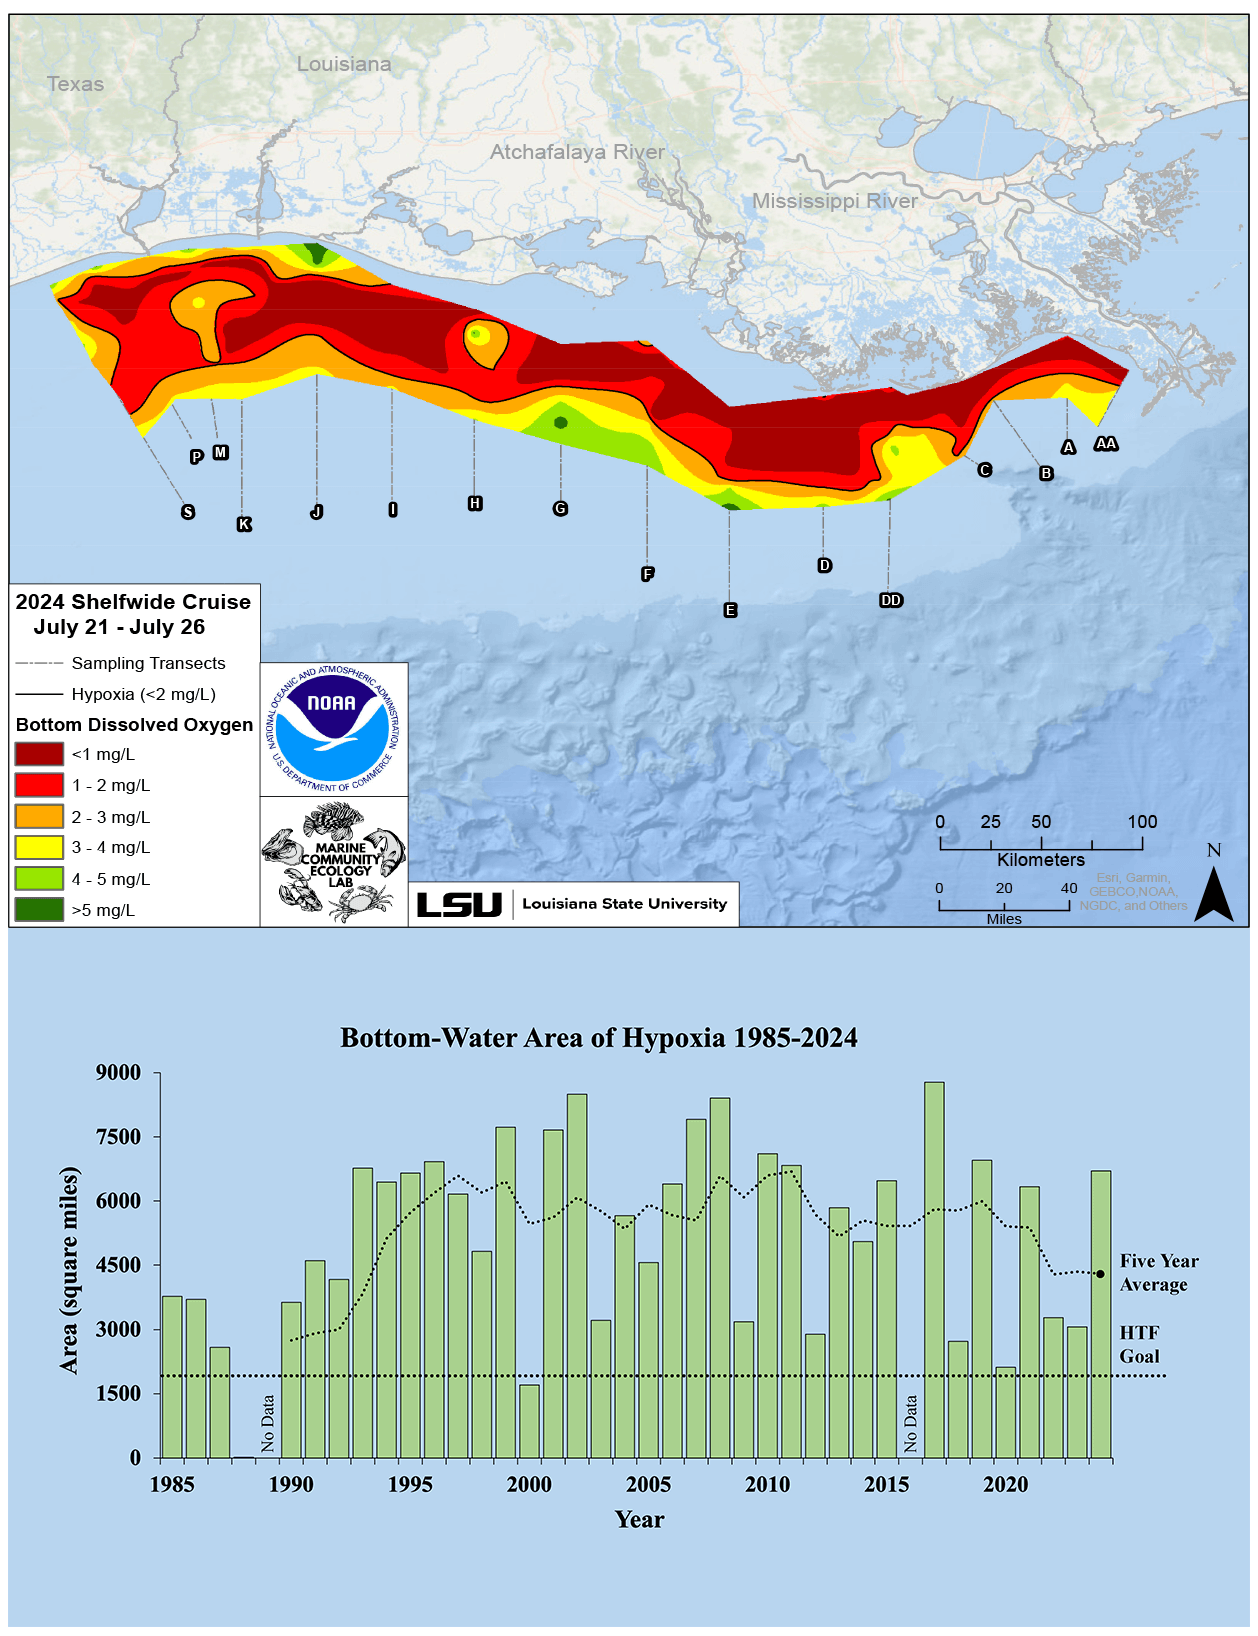
Figure 4. The area of the summer 2024 Gulf hypoxia zone and the history of the size of the zone from 1985. The flat dotted line is the target goal of the Mississippi River/Gulf of Mexico Watershed Nutrient Task Force. The irregular dotted line is the 5-year running average size of the bottom-water hypoxic zone. Image: LUMCON/LSU/NOAA.
Normal oxygen levels in the Gulf of Mexico are above 8 mg/L. Benthic organisms – those that live in the bottom water – tend to be less mobile and are at greater risk of dying as a result of hypoxia. The summer 2024 hypoxic zone was approximately 17,366 sq km (6,705 sq mi; equal to about 18% of the size of Indiana and more than half the size of Belgium).
The regulatory process for water pollutants inevitably goes more slowly than the creation of chemical compounds. In the US, PFAS regulations only require monitoring of 6 classes of PFAS by 2027, and public water systems must begin to implement measures to remove those classes by 2029. Pharmaceutical compounds are also largely unregulated as water pollutants.
“The term “pollutant” means dredged spoil, solid waste, incinerator residue, sewage, garbage, sewage sludge, munitions, chemical wastes, biological materials, radioactive materials, heat, wrecked or discarded equipment, rock, sand, cellar dirt and industrial, municipal, and agricultural waste discharged into water.”
https://www.epa.gov/cwa-404/clean-water-act-section-502-general-definitions#
https://www.pca.state.mn.us/air-water-land-climate/water-pollutants
Consider using the classes at https://en.wikipedia.org/wiki/Water_pollution
Read up on https://en.wikipedia.org/wiki/Clean_Water_Act before starting the categories.
“The term “pollutant” means dredged spoil, solid waste, incinerator residue, sewage, garbage, sewage sludge, munitions, chemical wastes, biological materials, radioactive materials, heat, wrecked or discarded equipment, rock, sand, cellar dirt and industrial, municipal, and agricultural waste discharged into water.”
https://www.epa.gov/cwa-404/clean-water-act-section-502-general-definitions#
https://19january2021snapshot.epa.gov/report-environment/sustainability-and-roe_.html – why is sustainability in the EPA Report on the Environment
https://thehill.com/changing-america/sustainability/environment/600070-about-half-of-us-water-too-polluted-for-swimming/
https://www.epa.gov/sites/default/files/2017-12/documents/305brtc_finalowow_08302017.pdf
https://www.pca.state.mn.us/air-water-land-climate/water-quality-trends-and-data – minnesota impaired waters
https://www.nlc.org/article/2024/04/19/6-things-for-local-leaders-to-know-about-epas-new-pfas-drinking-water-regulations/#:~:text=New%20Drinking%20Water%20Requirements&text=However%2C%20the%20EPA%20has%20set,detection%20possible%20with%20current%20technology.
US Water Pollution Control
Federal water pollution law applies to those bodies of waters considered to be waters of the US, a designation that is subject to legal interpretation, and has varied of time. So-called “navigable waters,” interstate waters, coastal waters up to 12 miles from shore, and certain tributaries and wetlands associated with these are presently considered to be waters of the US. States may chose to further regulate water quality – for example, to protect a greater proportion of wetlands from being filled in – so long as those waters are within state boundaries.
The primary laws regulating water pollution in the US are the Clean Water Act of 1972 and the Safe Drinking Water Act of 1974. Both are the responsibility of the US EPA, which works with states on many aspects of water quality. Entities of all kinds that seek to discharge pollutants into US waters from a point source (usually a pipe of some kind) must apply for permits called National Pollutant Discharge Elimination System permits (NPDES permits). The definition of “pollutant” is very broad and includes municipal, industrial, and agricultural wastes. Point sources, by law, include concentrated animal feeding operations such as stockyards and poultry barns and exclude agricultural stormwater discharges and return flows from irrigated agriculture.
NPDES permits set a maximum threshold for pollutant amounts or levels that can be discharged; the goal of the permits is to ensure that waters meet state water quality standards and minimum Federal standards. The EPA sets specific numeric standards for a subset of pollutants that can harm human health, fisheries, and wildlife. States may set more stringent standards and may regulate substances for which federal regulations are not yet available. State standards are set through a process that involves public input and EPA review.
The WHO does not recommend a uniform international enforceable standard for drinking water. Instead, WHO advocates a local risk-benefit approach (qualitative or quantitative) for establishing national standards and regulations according to local needs and resources [8]. WHO therefore issues guidance for developing national and regional drinking water standards, recommends periodic review of these standards, and suggests that updates can be made readily. While WHO has issued guidelines for numerous drinking water contaminants, none are legal or enforceable standards, as WHO is not a regulatory body. However, many countries rely on WHO guidelines as the basis for their drinking water standards [8]. Countries and territories that specify their own parameter values for drinking-water quality do so in a variety of formats: regulations, standards, specifications, laws, decrees, requirements, and norms. With very few exceptions, the majority set regulatory values equal to or more stringent than the WHO Guideline [9, 10].
https://www.nature.com/articles/s41370-023-00597-z
Media Attributions
- EPA ROE Drinking Water 1
- EPA ROE Drinking Water 2
- 2015 EPA Map of impaired waters © EPA is licensed under a Public Domain license
- Gulf dead zone 1985-2024 © LUMCON/LSU/NOAA is licensed under a Public Domain license