
Molecular Biology: From DNA to RNA to Protein
2 Methods to Study Proteins
2.1 Introduction: Molecules to Medicine
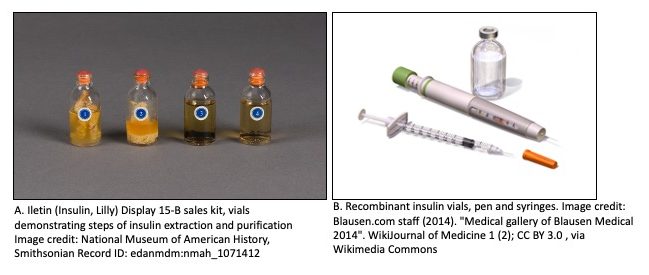
On Jan. 11, 1922, Leonard Thompson a 14-year-old boy received an experimental injection of insulin for the treatment of Diabetes at the Toronto General Hospital. Just days earlier he had been admitted for ‘end-stage diabetes mellitus. At the time diabetes was a life-shortening disease with a life expectancy of generally less than a year from diagnosis. No one expected the boy to live. The results were dubbed as miraculous.
Just a short 11 months earlier, Frederick Banting and medical student Charles Best had begun the classic experiments to show that pancreatic extracts could restore the ability of diabetic dogs to manage blood sugar.
With the help of biochemist, James Collip the team began to work on improving the purity of insulin made from cow pancreas using various extraction techniques.
To test if insulin was present and in what amount in each solution, they developed an insulin activity assay. The assay included monitoring blood sugar levels of rabbits after injection of each solution. Collip developed a measure or quantification of insulin activity based on the ability of the extract to lower the blood sugar levels in the rabbit.
In 1923, the Nobel Prize in Physiology or Medicine was awarded jointly to Frederick Grant Banting and John James Rickard Macleod “for the discovery of insulin”. (1)
2021 was the 100th anniversary of insulin’s discovery – the first life-saving treatment for diabetes. The story of insulin discovery and subsequent production is a great example of serendipity, persistence and the power of pursuing questions of consequence. It also highlights the role of biochemistry and the dawn of medicinal molecular biology.
In this chapter, we will learn the various protein methods to isolate proteins from a complex mixture in cells. In subsequent chapters, we will learn the tools of recombinant technology that allow us to generate human insulin using bacteria or yeast as production factories.
Learning Objectives
Levels 1 and 2 are factual information, knowledge-based. Level up indicated by the “Target” symbol is the goal.
When you have mastered the information in this chapter, you should be able to:
Level 1 and 2 (Knowledge and Comprehension)
- Define differential centrifugation and describe how it would be used to produce a protein mixture from a cell homogenate.
- Describe how a quantitative enzyme assay can be used to calculate the specific activity during protein purification
- Compare and contrast Gel Exclusion, Ion Exchange, and Affinity chromatography methods. [Related LO: List the properties of proteins that can be used to accomplish their separation and purification and correlate them with the appropriate methods: gel-filtration chromatography, ion-exchange chromatography, and affinity chromatography.]
- Describe SDS-PAGE. Explain the function of SDS, DTT/Beta Mercaptoethanol in SDS-PAGE.
- List the steps in performing a Western Blot.
- Explain when the technique of western blot is applied, and the kinds of questions one can answer by performing a western blot
⊕Level Up (Application, Analysis, Synthesis)
- Develop a purification scheme (Steps, type of chromatography, pH of buffers) for a protein within a given set of parameters.
- Interpret co-immunoprecipitation data.
- Interpret a western blot image/data from a scientific article.
- Identify or troubleshoot problems with a protein purification scheme based on the image of a stained SDS-page gel.
A special note for students: Lab methods can be difficult to learn by just ‘reading’ instead of ‘doing’.
I have provided videos and animations here to help you visualize the process. I hope those will help and I highly recommend watching them.
At the same time understanding the ‘why’s of the methodology is critical for troubleshooting, and troubleshooting is an important problem-solving skill. Therefore, do not skip reading the chapter as the theory is better laid out here.
In short, do both- Read and watch/listen!
2.2 Biochemical Assays
A successful protein purification procedure can be nothing short of amazing. What are the scenarios that require the isolation of a protein? A few are listed below
1) You want to study the function of a known protein.
2) You want to recapitulate a cellular process in a test tube and need to assemble the protein components.
3) You want to isolate a protein in pure form for structural biology (X-ray crystallography)
4) You are trying to identify a novel protein responsible for a function. For example, we will soon learn about DNA replication, an elaborate process of making identical copies of our genomes.
The proteins and enzymes involved in replication were identified by separating the cells into fractions and isolating those that demonstrated the desired activity (like the ability to add nucleotides to a growing strand).
Whether you are starting off with a recombinant protein produced in E. coli, or trying to isolate a protein from some mammalian tissue, you are typically starting with gram quantities of a complex mixture of protein, nucleic acids, polysaccharides, etc. from which you may have to extract milligram (or microgram!) quantities of desired protein at high purity, and hopefully with high yield.
As illustrated in the story of insulin, the first step in any purification is the development of a specific assay for the protein of interest.
An assay is a test, and experiments or procedure to measure a biological reaction or phenomenon. It is simply some way to measure and quantify both the presence of your protein inside the sample and its activity/function.
The specific assay can be based upon some unique characteristic of the protein of interest
- Enzymatic activity
- Immunological activity
- Physical characteristics (e.g. molecular mass, spectroscopic properties, etc.)
- Biological activity
Ideally, an assay should be
- Specific (you don’t want a false positive)
- rapid (you don’t want to wait a week for the results)
- sensitive (you don’t want to consume all your sample in order to assay it)
- quantitative (you need an accurate way to measure the quantity of your protein at each step in the purification)
Examples: Developing Assays
Reconstituting Motility from the Squid Giant Axon from XBio Media on Vimeo. For more information, see Ronald Vale’s Key Experiment on Motility in a Test Tube in The Explorer’s Guide to Biology (explorebiology.org/collections/cell-biology/motility-in-a-test-tube).
During purification, you will need to keep track of several parameters:
- The total amount of all proteins present in your sample (estimates obtained by measure absorbance at 280nm often suffice)
- The target protein activity (the one you are trying to purify) in your sample. This information will be determined from the quantitative assay you have established. Measuring the activity in the volume of fraction used in your assay and multiplying by the fraction’s total volume.
As you progress through steps of a purification you want to know if your methods are working! Are you getting pure protein (with minimal contaminants?) and how much of it?
3. Specific Activity of a sample gives you a measure of purity. Calculate as follows: Target Protein Activity / Total amount of Protein (“units of activity” /mg total protein)
By comparing the specific activity over different stages you get a sense of purity ( final specific activity / initial specific activity).
However, purification is not the entire story. We also need to consider yield.
Yield (%) = (target protein activity after purification step / initial target protein activity in cell lysate) x 100.
In general the goal of purification is to maximize specific activity. In designing a purification scheme you have to balance purity with yield.
- For example, it may be relatively straightforward to obtain 90% pure material with a good yield.
- However, it may be difficult to improve that purity by an additional few percentiles and still maintain a good yield.
- The planned application of the purified protein determines the target purity.
- If the protein is to be used to determine amino acid sequence information, maybe 90% is acceptable. However, if the material is to be used in clinical trials, 99.999+% may be the target purity.
Did I get this?
2.3 Isolating Proteins from Complex Mixtures
With an assay in hand, the next step in protein purification is to break open the cell/ source material. Early insulin preparations utilized cow pancreas!
2.3.1 Cell Disruption
There are several ways to break open cells. Lysis methods include lowering the ionic strength of the medium cells are kept in. This can cause cells to swell and burst. Mild detergents may be used to enhance the efficiency of lysis.
Depending on your starting material you may need additional assistance. Most bacteria, yeast, and plant cells have a cell wall and are resistant to such osmotic shocks. Here, enzymes may be useful in helping to degrade the cell walls.
Lysozyme, for example, is very useful for breaking down bacterial walls and commonly added to lysis buffers. Another enzyme commonly employed is cellulase when plants are used as starting material.
Mechanical agitation may be employed in the form of tiny beads that are shaken with a suspension of cells. As the beads bombard the cells at high speed, they break them open.
Sonication (20-50 kHz sound waves) provides an alternative method for lysing cells. The method is noisy, however, and generates heat that can be problematic for heat-sensitive compounds.
Pressure Disruption: In this method, cells are placed under very high pressure (up to25,000 psi). When the pressure is released, the rapid pressure change causes dissolved gases in cells to be released as bubbles which, in turn, break open the cells.
Cryopulverization: is often employed for samples having a tough extracellular matrix, such as connective tissue or seeds. In this technique, tissues are flash-frozen using liquid nitrogen and then ground to a fine powder before extraction of cell contents with a buffer.
Whatever method is employed, the crude lysates obtained contain all of the molecules in the cell, and thus, must be further processed to separate the molecules into smaller subsets, or fractions.
This soupy mess of everything inside the cells is called Crude Extract/ Homogenate/Cell Lysate.
2.3.2 Fractionation
Fractionation of crude extract starts with centrifugation. Using a centrifuge, one can remove cell debris, and fractionate organelles (when working with eukaryotic cells), and cytoplasm. For example, nuclei, being relatively large, can be spun down at fairly low speeds. Once nuclei have been sedimented, the remaining solution, or supernatant, can be centrifuged at higher speeds to obtain the smaller organelles, like mitochondria.
This stepwise process of fractionating cellular organelles is called Differential Centrifugation.
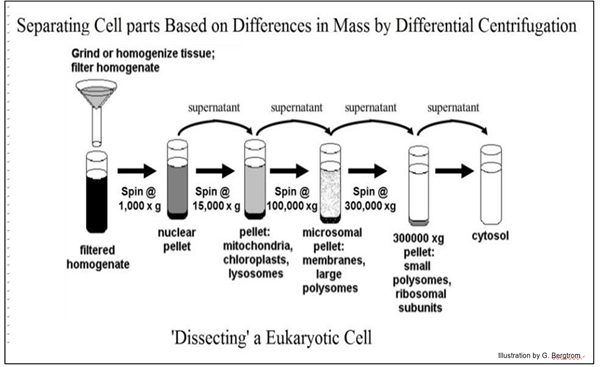
Each of these fractions will contain a subset of the molecules in the cell. Although every subset contains fewer molecules than the starting material, there are still many hundreds of molecules.
Separating the molecule of interest from the others is where chromatography comes into play.
Watch Dr. Mehta’s Lecture Video here: How to Study Proteins- Cell Lysis and Centrifugation
2.4 Column Chromatography
Proteins differ in size, charge, shape, and affinity for other proteins or molecules. These differences in properties can be exploited to begin to separate a protein of choice away from others. The method most commonly used is Chromatography.
Since the techniques we discuss here involve solutions (mixtures) this is Liquid Chromatography.
Here the mobile phase (buffered solution or other solvents) moves through the stationary phase (usually a column that is contains a resin or some matrix). As this happens the components of the mixture interact with the “stuff” inside the column in different ways or will move at different rates resulting in separation of the components.
In most cases chromatography is performed in long glass tubes filled with a matrix or resin of beads, hence the term Column Chromatography.
The type of resin or matrix inside the column is chosen based on the property that will be exploited for separation.
We will discuss the following three:
- Gel exclusion chromatography- separation based on size
- Ion exchange chromatography- separation based on charge
- Affinity chromatography- separation based on binding affinities of sample molecules (typically proteins) for molecules covalently linked to the support beads.
Regardless of the type of chromatography, there are some common steps and terms associated with all types of chromatography.
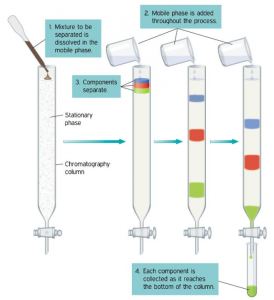
1. Column equilibration: A buffer that is compatible with the protein of interest and the resin of choice is passed over the column.
2. Sample loading: The ‘lysate’ which is the mixture of proteins is added to the top of the column. The sample is generally loaded in a buffer with the same composition as the equilibration buffer. The mixture of proteins is drawn down the column interacting with the matrix chosen. Proteins not interacting with matrix pass through the column and termed flow-through.
3. Washing: In ion exchange or affinity chromatography, proteins that interact only weakly or nonspecifically with the matrix are removed by washing the column with several column volumes of wash buffer.
4. Final Column Washing or Elution: The step to remove the desired protein from a column is referred to as elution. The buffers used to are referred to as ‘Elution Buffers’.
During the entire process samples are collected from the bottom of the column in small fixed volumes called “Fractions”. The fractions in which the desired protein may be present are referred to as eluates.
The process of collecting fractions is often automated and most ‘fractions’ are kept to assay for protein content and activity.
This allows experimenters to identify fractions containing protein of interest. Often several fractions (example those that show specific activity) are pooled and taken on to the next step of purification.
2.4.1 Size Exclusion Chromatography
Size exclusion chromatography (Other names used include molecular exclusion chromatography, gel exclusion chromatography, or gel filtration chromatography) is a separation method based on size.
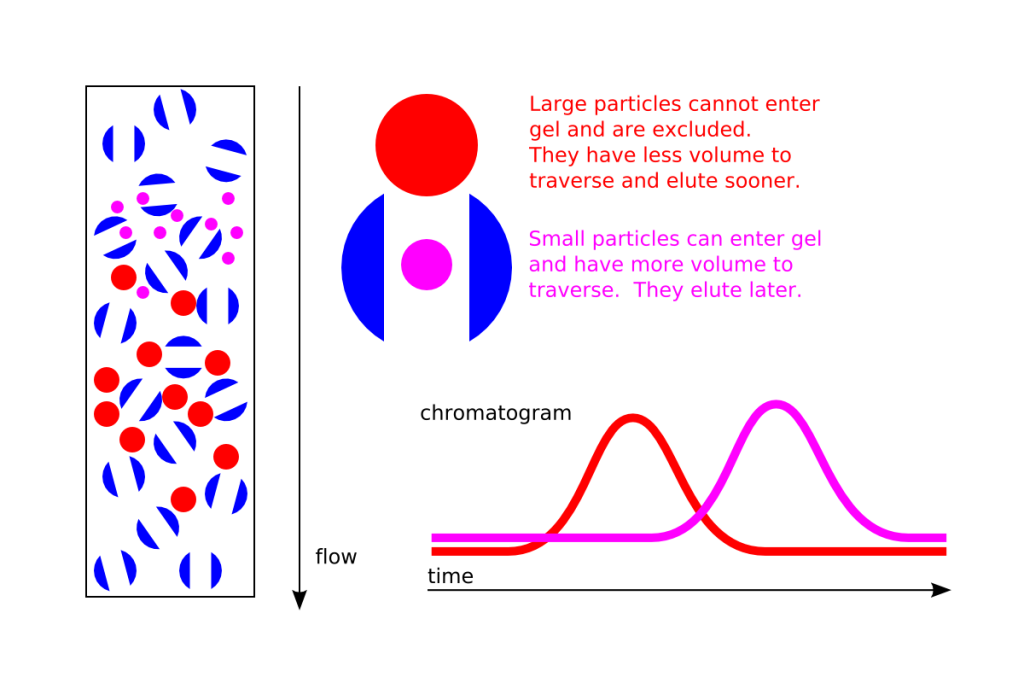
The column resin or matrix consists of beads with tiny “tunnels” in them with openings of a precise size.
The size of the opening is referred to as an “exclusion limit,” which means that molecules above that limit ( a certain molecular weight ) will not be able to pass through the tunnels and instead pass through the column quickly, making their way between the beads. These come out of the column (elute) first or earlier.
Smaller proteins can enter the pores or “tunnels” of the beads, and therefore take a longer path before they exit the column.
Thus in a mixed sample or proteins with differing sizes, separation will occur based on molecular size : the larger proteins will come off the column in earlier fractions and the smallest ones later.
For most general lab methods the size of protein is equated with its mass or molecular weight.
The unit of molecular weight for proteins is Daltons (Da- atomic mass unit) or kilodaltons (kDa– 1000 Da). Typically, the protein size or molecular weight is an approximation of the sum of the molecular weights of all its amino acids.
There are online programs that will tell you the size of a protein of a known sequence.
For a really rough estimate, scientists can use the average molecular weight of an amino acid – 110Da and multiply by the # of amino acids in the protein.
For example, A protein with 100 amino acids is ~ 11.0 kDa.
2.4.2 Ion exchange chromatography
In ion-exchange chromatography, proteins are separated according to differences in their charge. Here, the column is packed with a resin of tiny charged beads. The charge on the bead is a result of chemical ions attached to them.
In a cation-exchange column, the resin consists of beads that are negatively charged. Thus proteins with a positive charge (cations) bind ionically to the matrix.
[Note: In reality, the positively charged proteins present in a mixture going through the column will exchange with the counter-ions on the bean and “stick” to the negatively charged groups on the beads therefore the term cation-exchange]
In an anion-exchange column, the matrix is positively charged and proteins with a negative charge bind ionically to the matrix.
Molecules in the sample that are neutral (no net charge) or the opposite charge will pass quickly through the column.
Consequently, in order to elute the ‘stuck’ proteins, it is necessary to alter the affinity of the protein for the column. This is done by either gradually increasing the salt concentration of the buffer that will be poured over the column. The increase salt concentration weakens the ionic interactions by competition.
Altering the pH of the buffer also can help release ‘stuck’ proteins as pH will change the net charge on the protein.
Recall in Chapter 1 we discussed the relationship between the charge on the ionizable side chains of proteins and the pH of the environment.
All proteins have a pH value at which the net charge on the protein is ZERO. This pH is referred to as the Isoelectric Point or pI of a protein.
Therefore the net protein charge can be altered by changing pH or by adding salt to neutralize the charge.
Picking the appropriate pH for buffers (sample and column buffer, elution buffer) is key as the pH can alter the charge of the protein, which in turn will determine which proteins ‘stick’ to beads and which ones do not.
Knowing the pI of the protein helps experimenters to determine the appropriate pH for the buffers and design a purification protocol using ion exchange resins.
For proteins with a known amino acid sequence, there are handy computer programs that generate an approximate pI.
******************* REMEMBER THIS ******************************
If the pH of a buffer is less than the pI of the protein, then the protein/peptide will be positively charged.
pH < pI, Protein Positive
If the pH of a buffer is greater than the pI of the protein, the protein/peptide will be negatively charged.
pH > pI, Protein Negative
Let’s Illustrate With an Example
Protein # 1 in your mixture has a pI of 7.0. You have a Cation Exchange Column.
Recall in Cation Exchange the beads are negatively charged, and proteins that are positively charged will ‘stick’ to the column.
Your sample buffer should have a pH that is less than 7.0, which will enable the protein to have a positive charge.
Once the sample is applied, to make protein #1 “unstick” or “elute” you will have to raise the pH of your buffer to above the pI of the protein!
Did I get this?
Learning Objective – Development of a Purification Scheme.
If characteristics are known about the target protein, such as size and charge, it is possible to devise a purification scheme to obtain the target protein. Additional proteins may co-purify with the target protein, so it may be necessary to modify or add additional steps to the purification scheme.
Question: Devise a purification scheme to purify protein C from a mixture of A, B, C, and D. The properties of the proteins are given below. You can use gel filtration, anion, or cation exchange columns in your purification scheme.
| Protein | # of Amino Acid Residues (Mol Weight) |
pI (Iso electric point) |
|---|---|---|
| A | 120 (13,200 Da) | 7.5 |
| B | 120 (13,200 Da) | 7.5 |
| C | 120 (13,200 Da) | 6.5 |
| D | 240 (26,400 Da) | 8.0 |
Think about what do you need to know to solve this problem.
- What are the differences between the proteins in size, and charge that can be used to separate the proteins?
Molecular Weight: We can separate A, B, and C from D based on differences in molecular weight.
Charge: We can separate C from A and B based on the difference in isoelectric point.
2. What is the relationship between pH and pI?
Buffer pH will determine the net charge on proteins. If the pH of the buffer is the same as the pI of the protein, then the protein will carry zero net charge. If the protein is suspended in a buffer whose pH value is less than the protein’s pI, the protein will pick up protons from the buffer and hence have a net positive charge. Conversely, if the protein is suspended in a buffer more alkaline than the protein’s pI, the protein will lose protons to the buffer and become net negatively charged.
3. Types of chromatography.
Solution: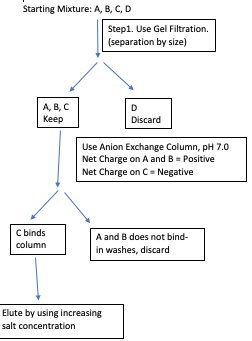
Before you continue you should
- Watch any lecture videos that cover the material above.
- Complete associated quick checks or problems.
2.4.3 Affinity chromatography
Affinity chromatography is a another powerful technique for purifying proteins. The technique exploits the binding affinities of proteins for other molecules or chemical groups. In contrast to ion-exchange chromatography, where all molecules of a given charge would bind to the column, affinity chromatography exploits the specific binding of a protein or proteins to a ligand that is immobilized on the beads in the column.
For example, if one wanted to separate all of the proteins in a cell lysate that binds to ATP from proteins that do not bind ATP, one could use a column that has ATP attached to the support beads and pass the sample through the column. All proteins that bind ATP will “stick” to the column, whereas those that do not bind ATP will pass quickly through it. The bound proteins may then be released from the column by adding a solution of ATP that will displace the bound proteins by competing, for the proteins, with the ATP attached to the column matrix.
A common form of affinity chromatography involved the use of a specific antibody attached to an inert resin.
When done on a small scale this is also termed Immunoprecipitation or Immuno-Affinity chromatography (See diagram below)
Antibodies, which are also proteins (also called immunoglobulin) are powerful toosl for protein biochemistry. Antibodies are synthesized by animals in response to a foreign substance (antigen). They are very specific and bind with high affinity to antigens (like parts of a protein for example) making them the ideal tool in affinity chromatography and other methods used to identify proteins as we shall see below.
Watch the video below for why antibodies are useful and commonly used in research. Parts between time stamps 1:50 and 3:01 can be skipped.
Bonus: As you listen to the description of antibody protein structure pay attention to terms you encountered in Chapter 1!
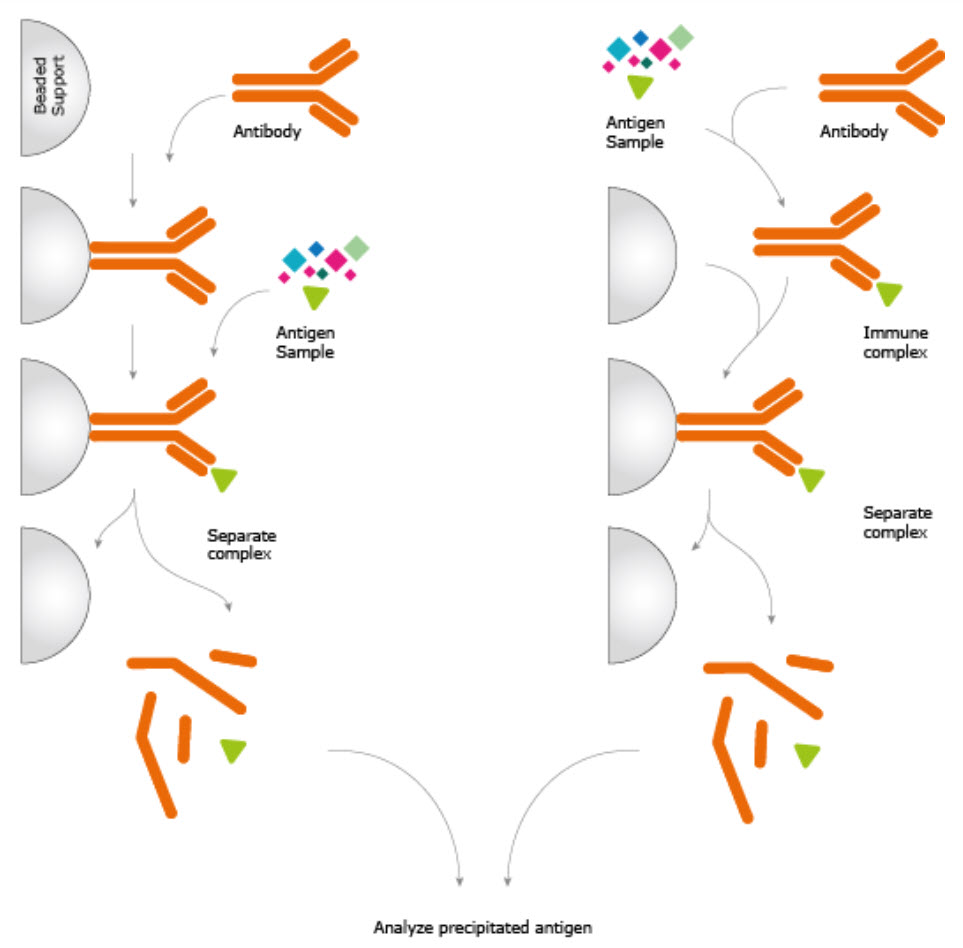
Immunoprecipitation Experiment. The antibody is either pre-immobilized to a solid support or immobilized using antibody-binding proteins after incubation with the sample. Immobilization allows the immune complex to be extracted from the complex sample, washed, and eluted providing a high enrichment of the protein under investigation. Image from the Human Protein Atlas
2.5 SDS-PAGE and Western Blotting
- Assays will establish your protein of choice is present within the sample, but cannot tell you if there are other contaminants.
- A commonly used technique for detecting the presence of any protein inside a sample is SDS-PAGE followed by staining of the gel.
- To detect the presence of a specific protein a Western Blot is used.
2.5.1 SDS-PAGE –Sodium Do-decyl Sulfate Poly Acrylamide Gel Electrophoresis
Let’s break the name apart:
Gel Electrophoresis: Is a method that uses an electric field across a gel matrix to separate (phoresis) large molecules. Samples are loaded into the wells of the gel matrix that can separate molecules by size and an electrical field is applied across the gel. This field causes negatively-charged molecules to move toward the positive electrode.
The gel acts as a sieve, through which the smallest molecules pass rapidly, while longer molecules are slower-moving.
Polyacrylamide: when the gel-like matrix is made utilizes a chemical polyacrylamide. This is a polymer comprised of two covalently-linked components:
- acrylamide
- bis acrylamide.
When mixed together they form a mesh that functions as a sieve. As the proteins undergo electrophoresis, they are separated according to their molecular weight because of the sieving properties of the polymer strand in the gel.
- Smaller proteins have a much easier time moving and therefore migrate a larger distance.
- Larger proteins have a more difficult time and therefore migrate a smaller distance.
NOTE: Most common SDS-PAGE gels will not be able to resolve proteins that differ by a few amino acids in size. A different method is needed to further separate 2 proteins that are very close in size.
( For a visual of how a PAGE gel is made see Link to Learning.)
That covers the PAGE part of SDS- PAGE.
We now have everything in place to perform a gel electrophoresis experiment to separate proteins, but there is another consideration related to proteins we need to account for. Remember, different proteins have different charges for a given value of pH.
Thus, proteins will migrate as a function of both their mass (large ones move slowly) and their overall net charge.
To separate proteins based only on MASS alone and not charge we need a way to equalize the charge on all proteins in a sample.
This is where the ‘SDS’ comes in.
Role of SDS
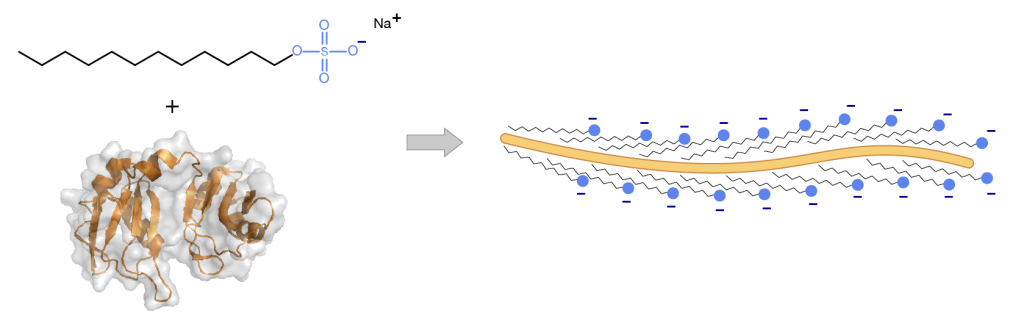
Sodium dodecyl sulfate (SDS; also known as “laurel sulfate”) is an ionic detergent. It has an anionic head group and a lipophilic tail. SDS binds, via hydrophobic interactions, to the proteins in a stoichiometry approximately proportional to the size of the protein (i.e. a small protein will bind a few molecules, and a large protein will bind a lot of molecules of SDS)
SDS accomplishes a couple of useful things:
1) SDS causes proteins to denature and disassociate from each other (excluding covalent cross-linking) and unravel into linear molecules.
2) Due to the charged nature of the SDS molecule the proteins all proteins will have a negative charge!
This is useful to us! Now all proteins in the sample will have an approximate constant charge to mass ratio and will migrate through the gel at a rate proportional to their molecular mass alone.
Protein gels are usually performed under denaturing conditions. Sample preparation involves heating the protein in the presence of SDS to fully unfold the protein and permit binding of SDS throughout the length of the polypeptide.
In addition, recall that many proteins can be stabilized by disulfide bonds which are covalent bonds. The samples that are prepared for SDS-PAGE are also often treated with reducing agents like beta-mercaptoethanol, and dithiothreitol (DTT). These reagents will reduce disulfide bonds and separate polypeptide chains that are connected by such bonds.
In setting up the SDS PAGE experiment we need to know when to stop the experiment. Again, this is somewhat difficult since proteins (even with SDS bound) do not absorb in the visible spectrum or have a color! i.e. we cannot simply look at the gel to determine when the proteins have been separated or reached the bottom of the gel.
Therefore, it is common to include in the protein sample a small anionic dye molecule (e.g. bromophenol blue).
Typically, all of the reagents mentioned above (SDS, reducing agents, dye) are pooled in a ‘Sample Buffer’. The protein/SDS/dye mixture is loaded on the top of the gel (i.e. cathode side) and when the dye molecule (the “dye front”) reaches the bottom of the gel, the power is turned off and the experiment halted.
Visualization of the separated proteins
Once the proteins are separated within the gel they are still invisible and must be visualized by staining. A common protein stain is Coomassie Brilliant Blue R-250. The fixed gel is incubated in a solution of “Coomassie stain” and then the stain is washed out of the gel. The stain will not bind to the acrylamide and will wash out (leaving a clear gel). However, it remains strongly bound to the proteins in the gel, and these take on a deep blue color.
Since with SDS treatment, the proteins will migrate as a function of their molecular mass. The approximate molecular mass of the separated proteins is therefore a function of their migration distance.
A “protein molecular weight marker” (also called a “ladder”, standard) is typically included on either of the two sides. The marker is a series of proteins with different and known molecular masses. This allows the user to determine the molecular weight of each protein in the sample.
[Note: Accurate estimations can be made by measuring the distance a protein migrated in a gel and establishing a standard curve. ]
Remember that staining of a SDS-PAGE gel by Coomassie Blue visualizes ALL proteins in the sample/gel, but does not allow for detection of specific proteins.

For our purposes, remember we started with wanting a method to ‘know’ if a particular protein(s) is/are present in the sample. If we know what the molecular weight of your protein is then then SDS-PAGE provides a good way of visualizing the progress of a protein purification scheme.
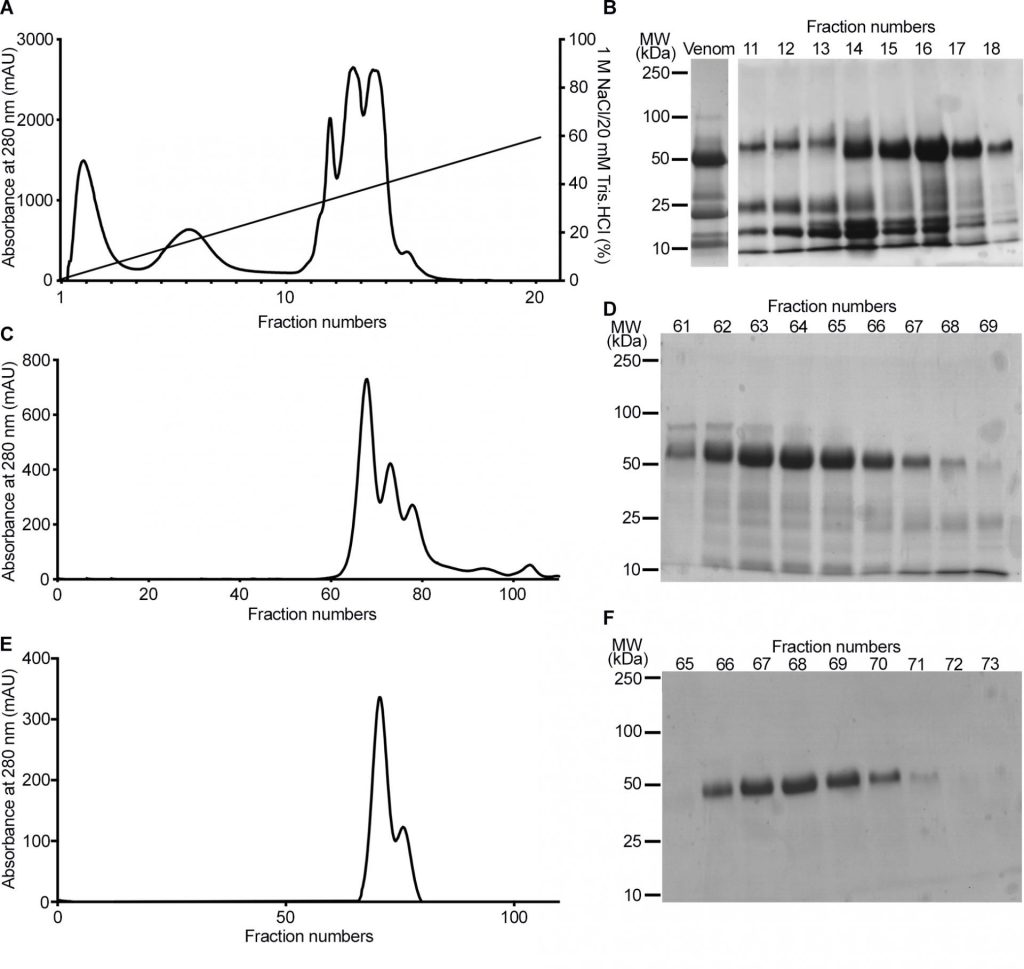
Below is an example from a scientific paper that illustrates the use of stained SDS-PAGE to follow the purification of a protein using various chromatographic techniques mentioned earlier. Here the authors are isolating (purifying) an enzyme found in Snake venom.
Problem Solving Exercise
Study the figure below.
- Look at the axes and labels.
- Try to correlate the graphical presentation with your understanding of chromatographic techniques.
- (A) (C) and (E) are chromatograms. What does the Y-axis represent? What are the peaks?
- B, D and F are SDS-PAGE gels.
- What do the numbers in left represent? What are the fractions? What do the bands show?
- Fractions 62–67 were pooled and subject to gel filtration chromatography.
- Notice the difference in the SDS-PAGE gel image between D and F ? What do you think happened during gel filtration?
2.5.2 Western Blotting
While for many purposes SDS-PAGE followed by staining is sufficient to identify the presence of a protein by molecular weight, it does not tell you the identity of the protein beyond that!
Western blotting is a technique that allows for the visualization of a specific protein in a gel. Western blots can also assess how much of a particular is present in a sample.
In a western blot procedure, proteins are first separated on an SDS-PAGE gel and then transferred to a paper-like membrane. This membrane replica is treated with a primary antibody that specifically recognizes a protein of interest. Then, the membrane is incubated in a secondary antibody, which binds to the primary antibody based on what species the primary antibody was raised in. (For instance, the secondary antibody might be something like anti-rabbit IgG.) Additional processing steps generate a signal at the position of the bound antibody. Between the steps, various washes are done to increase the signal-to-noise ratio on the final, developed blot.
Steps of Western Blot after the SDS page include:
- Electrophoretic transfer of proteins from an SDS-PAGE gel to a membrane
- Blocking of nonspecific protein binding sites on transfer membranes
- Incubation of the membrane with a primary antibody specific for the epitope of interest
- Incubation with a secondary antibody that recognizes primary antibodies
- Visualization of bound antibodies
The major steps in a typical western blot are diagrammed below.
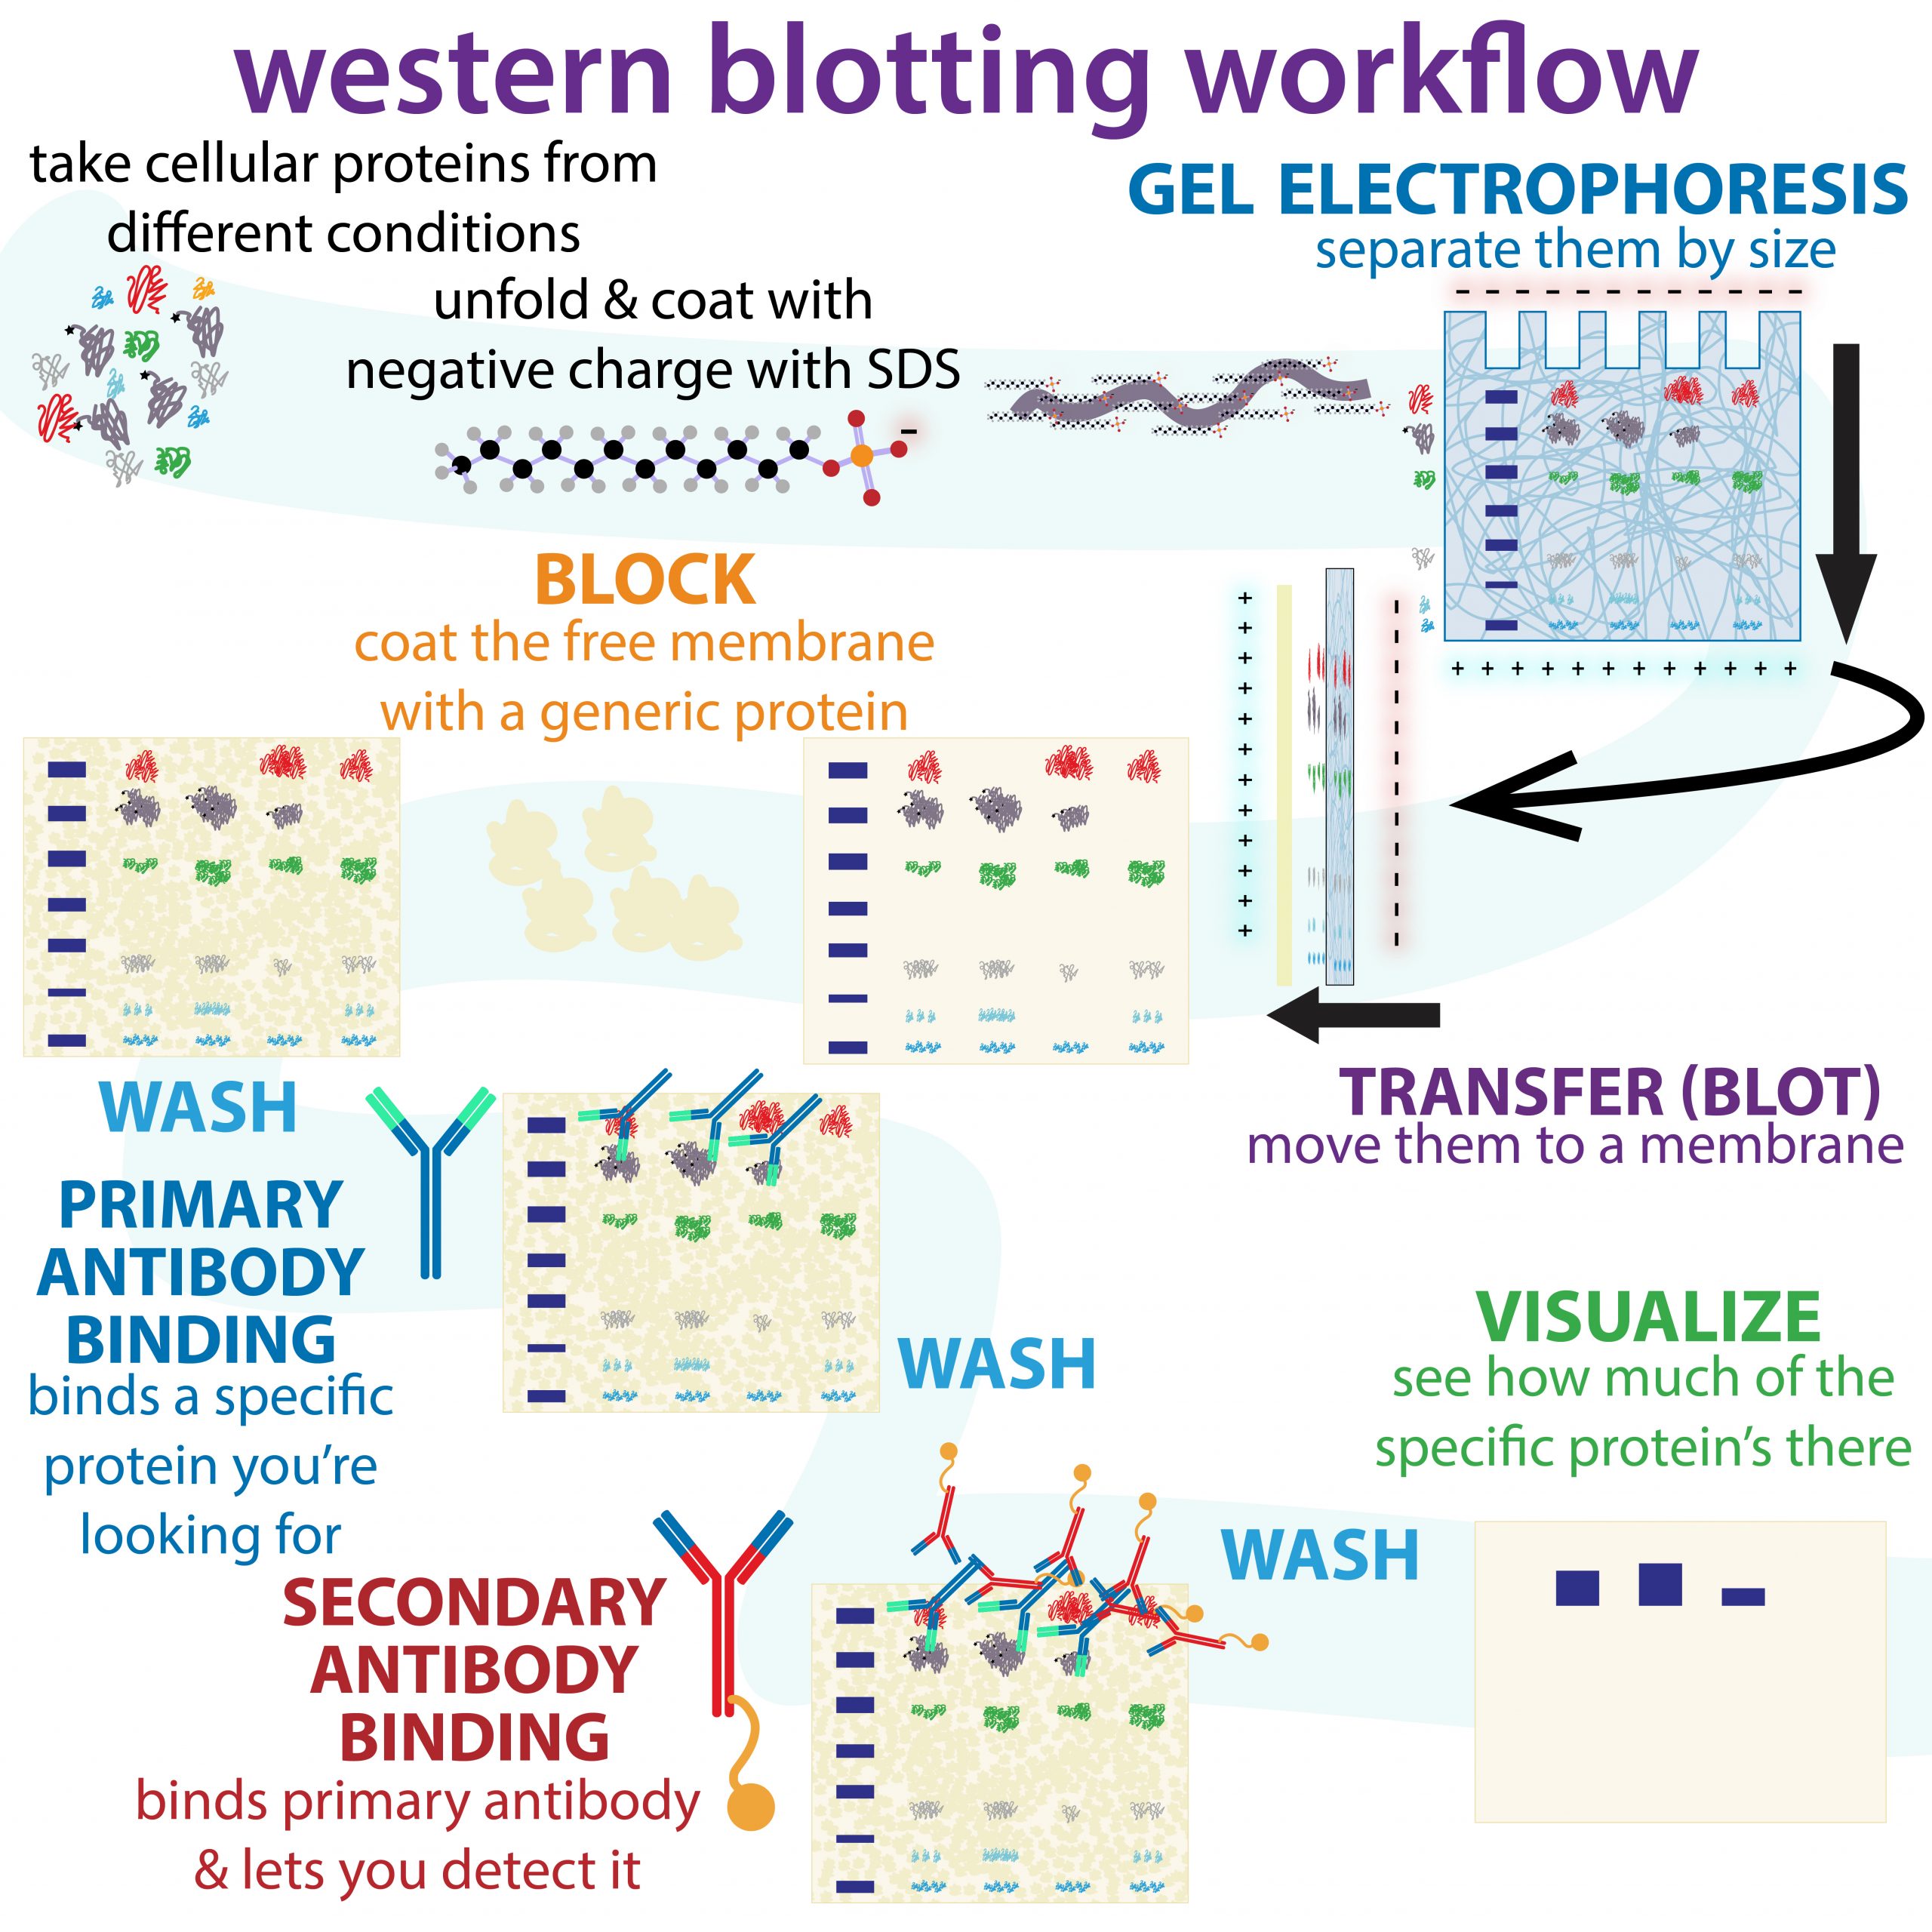
Figure 2.7 An infographic overview of the workflow for performing a western blot. Image credit: Bumbling Biochemist. Graphic made available under Biochemlife, CC BY-SA 4.0, via Wikimedia Commons. Artist URL here: https://thebumblingbiochemist.com/graphics/
Electrophoretic transfer of proteins from an SDS-PAGE gel to a membrane
A replica of the SDS-PAGE gel is generated by transferring proteins electrophoretically to a synthetic membrane with a high protein binding capacity.
During the transfer process, the gel and membrane are placed directly against each other within a “sandwich” of pre-wet filter papers and foam pads. During the electrophoretic transfer, the current should flow evenly across the entire surface area of the gel. After the electrophoretic transfer, the membrane replica with the transferred proteins can be allowed to dry out and stored for later visualization with antibodies.
Blocking of non-specific protein binding sites on membranes
The transfer membranes used in western blots bind proteins nonspecifically. Before the membranes are incubated with specific (and expensive) antibodies, they must be pretreated with blocking solutions that contain high concentrations of abundant (and cheap) proteins to saturate non-specific binding sites. Think of this step as analogous to an artist priming a canvas with a lower quality paint before the more expensive media is applied. If the transfer membranes are not adequately blocked before the antibody is applied, the nonspecific sites on the membranes will absorb some of the antibodies, reducing the amount of antibody available to bind the
target proteins.
Primary, Secondary antibody, and Visualization of proteins.
Protein detection usually employs two antibodies:
The primary antibody: specifically binds to the protein of interest on the blot. Increasingly, researchers are using epitope-tagged proteins in their experiments, because antibodies against naturally- occurring proteins are expensive and time-consuming to prepare. In addition, an antibody directed against an epitope can be used to detect many different proteins carrying that same epitope.
The secondary antibodies: Are designed to bind the FC fragments of primary antibodies and also carry an enzyme or reagent which can cause a reaction to produce a color upon further treatment.
Thus, the primary antibody binds the protein on the membrane, the secondary antibody binds the primary antibody and in the end, if the molecule of interest is in the original mixture, it will “light” up and reveal itself on the blot.
Interpretation of a Western Blot
Learning how to interpret Western blot data is a critical skill.
Watch the video below to get a brief overview of the kinds of questions one can answer using a Western blot. Students will practice with data (like the example shown above with SDS-PAGE) in class.
Co-immunoprecipitation (Co-IP)
A commonly used technique to study protein-protein interactions inside cells is an extension of IP called Co-IP for short if antibodies against the proteins of interest are available. These are also sometimes referred to as pull-down assays!
The principle is similar to that of a fishing line with bait. The goal is to use the potential of IP reactions to capture and purify the primary target (i.e., the antigen) but also any other protein that may naturally be associated with it inside the cells. The presence of the second protein (binding partners) is visualized during the western blotting stage by using antibodies to the different components.
Did I Get This?
Remember to:
- Watch the Lecture videos that cover the material above. This will help to clarify or reinforce certain concepts if they were unclear.
- Begin work on Problems
References and Attributions
- The Nobel Prize in Physiology or Medicine 1923. NobelPrize.org. Nobel Prize Outreach AB 2021. Sun. 25 Jul 2021. <https://www.nobelprize.org/prizes/medicine/1923/summary/>
- Williams, Harry F., Ben A. Mellows, Robert Mitchell, Peggy Sfyri, Harry J. Layfield, Maryam Salamah, Rajendran Vaiyapuri, et al.. 2019. Purification of CAMP from the venom of C. atrox. (version 1). PLOS Neglected Tropical Diseases. https://doi.org/10.1371/journal.pntd.0007041.g001.
This chapter is curated, adapted, and modified from the following CC-licensed sources:
- “Fractionation and Chromatography Techniques” by Kevin Ahern, Indira Rajagopal, & Taralyn Tan, LibreTexts is licensed under CC BY-NC-SA. The entire textbook is available for free from the authors at http://biochem.science.oregonstate.edu/content/biochemistry-free-and-easy.
- “Protein Purification” by Michael Blaber, Licensed under CC-BY-NC-3A. Available at: https://bio.libretexts.org/@go/page/18140]
- Western blot: ” Western blots involve many steps” by Clare M. O’Connor, LibreTexts is licensed under CC BY-NC-SA. Retrieved July 24, 2021, from https://bio.libretexts.org/@go/page/17590.
