
Tools and Techniques of Molecular Biology
Methods of Molecular Genetic Analysis based on DNA replication process
1. Methods of Molecular Genetic Analysis based on the DNA replication process
Learning Objectives
LEVEL 1 and 2
- List the 5 chemical components of a PCR reaction and describe their roles.
- List the functions of the 3 temperature cycles which are repeated during a PCR reaction.
- Describe the process of observing results and interpreting the results of a PCR experiment.
- List possible uses of PCR in genetic testing and in research.
- Explain the Quantitative or Real Time PCR method and differences with regular PCR
⊗ LEVEL-UP
- Design appropriate forward and reverse primer pairs when given a gene sequence.
- Design a PCR-based diagnostic test.
- Interpret electrophoresis results by distinguishing DNA fragments by length and determining whether individuals are homozygous or heterozygous at different STR loci.
- Interpret quantitative PCR data to evaluate differences in gene expression.
The Polymerase Chain Reaction (PCR) is an in-vitro method for amplifying DNA and the chemistry to sequence DNA; two cornerstone techniques that are widely used in molecular and recombinant DNA technology were developed directly from an understanding of enzymes used in the process of DNA replication.
1.1 Polymerase Chain Reaction
Developed in 1983 by Kary Mullis, PCR is a common technique used in medical and biological research labs for a variety of applications including the following:
- DNA cloning for sequencing; DNA-based phylogeny, or functional analysis of genes
- The diagnosis of hereditary diseases
- The identification of genetic fingerprints (used in forensic sciences and paternity testing)
- The detection and diagnosis of infectious diseases
In Vitro vs. In Vivo Replication
PCR is an In Vitro process that mimics cellular DNA replication in the test tube, repeatedly copying the target DNA over and over, to produce large quantities of the desired DNA. This laboratory technique is modeled after the In vivo process. However, unlike all the various components needed to replicate DNA discussed in this chapter, PCR works by using just one of these enzymes- DNA polymerase.
Mullis imagined a chemical reagent and a temperature change step in the method that could perform the work of the initiation and eliminate the need for helicases.
1.1.1 Components of PCR
A basic PCR setup requires the following components and reagents:
1. The DNA template is a sample of DNA that contains the DNA region (target) to be amplified.
2. Two primers.
Primers are short oligonucleotides of DNA, usually around 20 base pairs in length. Because the purpose of PCR is to amplify a specific section of DNA in the genome, such as a known gene, primers of specific sequences must be used. The experimenter will design a forward primer to bind to one strand and a reverse primer that complements and binds to the other strand.
This will also provide the polymerizing enzyme the needed 3′-OH group for extension (like DNA replication in cells need!)
The primer design process to select forward and reverse primers is important in designing the PCR and example exercises are provided later in this reading.
3. Thermostable DNA polymerase (to carry out the synthesis). The enzyme must have a good activity rate at around 75°C. Second, the enzyme should be able to withstand temperatures of 95-100°C without denaturing and losing activity.
One of the best-known thermostable DNA polymerases was first isolated from bacteria that grow in hot springs, such as those found in Yellowstone National Park, Thermus aquaticus. Named after the species, Taq polymerase is DNA polymerase I that retains polymerizing activity even at the high temperatures needed for melting the templates, and it is active at a temperature between the melting and annealing temperature.
Since then many better-performing DNA polymerases have been isolated with varying levels of efficiencies from other bacteria and archaea.
4. dNTPs (DNA nucleotides to build the new DNA strands). DNA polymerase will add each complementary base to the new growing DNA strand according to the original strand’s sequence following normal A-T and C-G pairings.
5. Finally, a reaction buffer. Buffer solution provides a suitable chemical environment for optimum activity and stability of the DNA polymerase.
1.1.2 The Three Steps
A key insight to the success of PCR as an in vitro DNA replication process was a three-temperature cycle that accomplishes three parts of DNA replication.
Before reading the description of PCR steps and how the components are used, complete the interactive below to help you visualize the importance of each step. Make sure you scross
LINK to LEARNING
The video below animates the process with spoken narration.
This video animation on LabExchange on PCR
Denaturation step: This step is the first regular cycling event and consists of heating the reaction to 94-98°C, near-boiling! At this temperature, all double-stranded DNA is “melted” into single strands
[Step 1 in Figure 1.1]
Annealing step: The reaction temperature is lowered to 50-65°C (range varies). This allows the primers to bind to complementary sequences in the single-stranded DNA template in the region of interest
The two primers are called the forward and the reverse primers and are designed because their sequences will target the desired segment of the DNA template for replication.
[Step 2 in Figure 1.1]
When planning the PCR analysis the experimenter “designs”’ and chooses the appropriate sequences for the forward and reverse primers and then buys them from a vendor who can synthesize single-stranded DNA with the specific sequence and length.
The two most important criteria for primer design are the following.
- BOTH strands of dsDNA need to be primed for PCR! The sequence should be complementary and antiparallel to the template strands.
- The primers must bind so that their 3′ ends are ‘pointing’ in the direction of the other primer. This ensures that the sequence in between the primers is replicated in the PCR cycles.
Designing primers for a PCR reaction is an important step and dictates much of the success of the PCR reaction.
The interactive link below presents the rules for designing precise nucleotide sequences called PCR primers.
LINK to LEARNING: Primer Design
Complete this interactive on Lab-Exchange to learn about primer design.
Primers are present in millions of fold excess over the template. This is important because each newly made DNA strand starts from a primer. Since the primers are present in great excess, the complementary sequences they target are readily found and base-paired to the primers.

Extension: The final PCR step is when the DNA polymerase enzyme reads the template and connects new nucleotides to the primer’s 3’ end, extending a new complementary strand of DNA. The test tube is heated to around 72-75°C, the optimal temperature for the polymerase to operate. DNA pol. III activity and the newly synthesized DNA strand is extended as the template strand is read by DNA pol. III.
[Step 3 in Figure 1.1]
There are now twice as many copies of your gene of interest as when you started!
Because thousands of copies of the forward and reverse primer are added at the start of PCR, all the single strand templates, both the original, the copies in cycle 3 and beyond, and the copies of the copies made from previous cycles will be primed for the extension step of the cycles.
Thermocyling in a typical PCR amplification is illustrated below.
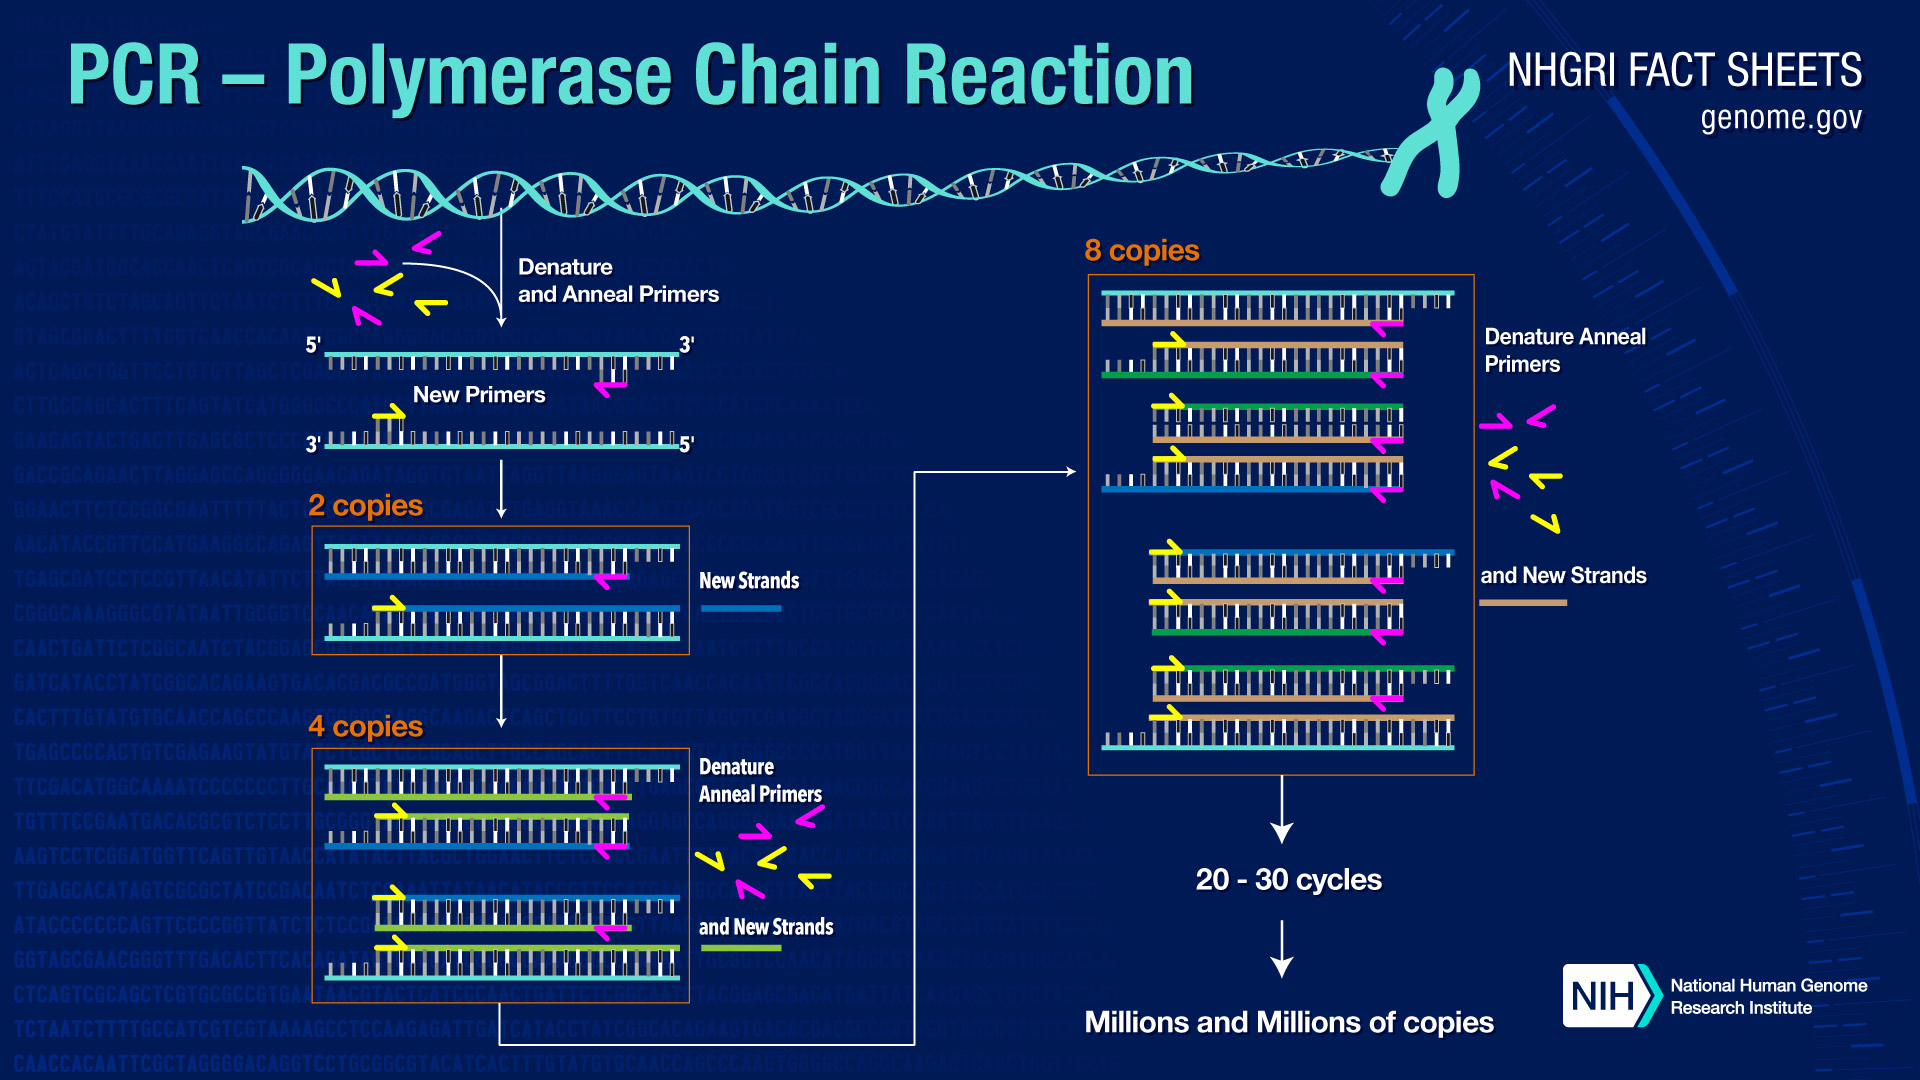
You can see from the illustration that the second cycle of PCR has generated the two DNA strands that will be templates for doubling and re-doubling the desired product after each subsequent cycle. A typical PCR reaction might involve 30 PCR cycles, resulting in a nearly exponential amplification of the desired sequence
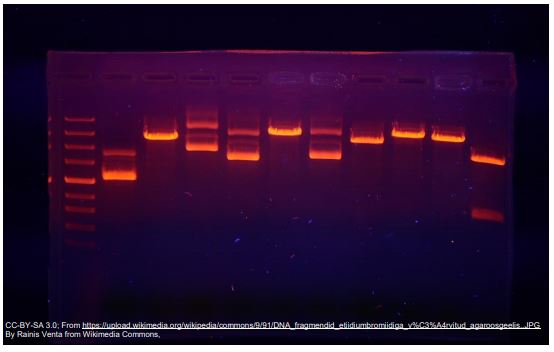
Visualizing the Results with Electrophoresis
Once a PCR reaction has been completed, we need to be able to see the results. To do this, a sample of the PCR mixture is loaded into an agarose gel for electrophoresis.
Did I Get This?
Apply concepts of primer design by completing this activity
Practice Exercises
1.2 Variations of PCR
1.2.1 Quantitative PCR (qPCR) or Real-time PCR
qPCR or Real-Time PCR follows the same principle of amplification as regular PCR (exponential amplification), however instead of needing gels to visualize the end product the process is monitored in “real time”, as suggested by the name.
A machine “watches” the reaction occur with a camera or detector. There are many techniques to allow monitoring of PCR in real-time but they all have one thing in common: linking the amplification of DNA to the generation of fluorescence. Thus as there is more DNA, there should be more fluorescence.
The ability to monitor in real-time and measure the accumulation of fluorescence means, unlike regular PCR, this method can provide a truly quantitative analysis of gene expression. Hence the other name for the same technique- Quantitative PCR (qPCR)
Methods used for generating fluorescence:
1) Use of an intercalating agent that binds only to double-stranded DNA.
A common dye used is Sybr Green. The principle is simple:
- the dye itself is fluorescent.
- the dye binds dsDNA and when bound to DNA increases in fluorescence.
- therefore as the PCR proceeds, more copies of DNA are made, and more dye binds an increase in fluorescence is observed.
2) TaqMan (style) Probes.
More commonly, qPCR is performed using TaqMan [Based on the name of the company and enzyme] technology.
With TaqMan, a third primer (TaqMan probe) is designed in the middle of the area to be amplified. This middle primer is designed with a hairpin self-complementarity so that the 5′ and 3′ ends are in close proximity.
At one end, a fluorescent reporter is attached while the other terminus has a quencher that absorbs any fluorescence signal. Under normal circumstances, measurements of fluorescence will be very low since the quencher is physically close to the reporter.
Taq Polymerase used in these reactions retains its 5′-3′ exonuclease activity. The probe is cleaved by the enzyme during the reaction separating the quencher and reporter. The quencher no longer has its effect on the reporter and the level of fluorescence increases.
This means that with every cycle of PCR more probe is cleaved and more fluorescence is generated.
The name TaqMan is a play on words since it is imagined that the polymerase is chewing up the probe like Pacman. With increased distance between quencher/reporter, the fluorescence signal from this probe can now be measured.
This method is much more specific than Sybr Green. However, the use of specific probes increases the cost considerably.
Watch this video below explaining this technology:
Nomenclature Used in Real-Time PCR and Data Interpretation.
First, take a look at the representation of real-time data.
The horizontal axis shows the PCR cycle number: how many cycles of melting, annealing, and primer extension have occurred.
Baseline: Is defined as PCR cycles in which a reporter fluorescent signal is accumulating but is beneath the limits of detection of the instrument. Fluorescence measurement early during the PCR process will be very low due to the small number of dsDNA molecules (Sybr Green) or most TaqMan primers being quenched. At this point remember that PCR cycles are still occurring and the product is doubling with each cycle.
During this exponential DNA production, a threshold will be reached in which the fluorescence will linearly increase.
ΔRn: Note that values obtained do not have absolute units associated with them. What is represented is an increment of fluorescent signal at each time point. The ΔRn values are plotted versus the cycle number.
Threshold: The dotted line is an arbitrary level of fluorescence chosen on the basis of the baseline variability. A signal that is detected above the threshold is considered a real signal that can be used to define the threshold cycle (Ct) for a sample.
The threshold can be adjusted for each experiment so that it is in the region of exponential amplification across all plots.
Ct value: is defined as the fractional PCR cycle number at which the reporter fluorescence is greater than the threshold.
The Ct is a basic principle of real-time PCR and is an essential component in producing accurate and reproducible data.
The Ct value is instructive when comparing samples or determining the relative amount of starting material.
Watch the videos below explaining how to interpret qPCR data.
What are Ct Values?
1.2.2 Quantitative Reverse Transcription PCR
Reverse transcription–PCR is a sensitive technique for the detection of mRNA. It is routinely used as a diagnostic test for the presence of RNA viruses, such as the agents causing AIDS, or SARsCoV2.
The difference between regular PCR and Reverse-Transcription PCR is in the first step. Since the starting material is mRNA we need to first convert it into DNA using a special enzyme called reverse transcriptase. We learn more about the details of how the conversion is done later in this unit.
Application in Diagnostics
Quantitative PCR can be used to detect the presence of genetic material from pathogens, like coronaviruses in human cells.
Coupling of reverse transcription followed by quantitative real-time PCR [ qRT-PCR ] is a powerful way to compare levels of gene expression (how much RNA was there, to begin with in the sample?).
This concept is also the basis behind using RT-quantitative PCR diagnostic for establishing viral load and/or infectivity for viruses with RNA genomes- like SARsCOV2!
1.3 Example Applications of PCR
1.3.1 Forensics- DNA Profiling
You learned in Chapter 3 that the difference in nucleotide sequences between humans lies is minimal. People are greater than 99% similar. But when you look at your classmates around the room, you can see that that small difference amounts to quite a bit of variation within our species. The bulk of these differences aren’t even within the coding sequences of genes but lie outside in regulatory regions that change the expression of those genes.
One such area of variation is the Short Tandem Repeats (STR). Recall that STRs are comprised of units of bases, typically two to five bases long (ex. TAATTAATTAAT). that repeat multiple times. The repeat units are found at different locations, or loci, throughout the genome.
If you were to read a repetitive set of sequences and count the repetition, you would make mistakes and lose count. Likewise, DNA polymerase will make errors or stutter in areas of repetitiveness and produce changes – expanding or contracting the number of repeats.
Any variation of a locus is referred to as an allele. In the case of STRs, these alleles are simply a difference in the number of repeats surrounded by nonvariable segments of DNA known as flanking regions. This means the length of DNA within this locus is either longer or shorter based on the number of repeats. This variability within the STR regions can be used to distinguish one DNA profile from another.
For example, the TH01 is a locus on chromosome 11 that has a repeating sequence of TCAT. There are reported to be between 3-14 repeats in this locus.
In the example below the repeat unit [TCAT] repeats 6 times, and along with the flanking region it will have set length in base pairs.
A different allele of this same STR would have a different number of TCAT repeat units but the same flanking regions.
Flanking regions are important because knowing their sequences enables geneticists to isolate the STR using polymerase chain reaction, or PCR, amplification.
TH01 STR: Outside of the STR, there are flanking areas of known sequence. The primers that amplify TH01 in PCR recognize these flanking sequences to amplify the TCAT repeats. Credit: Jeremy Seto (CC-BY-NC-SA)
CoDIS
DNA fingerprinting. Credit: Helixitta, The Photographer and Jeremy Seto (CC-BY-SA 3.0)
The FBI and local law enforcement agencies have developed a database called the Combined DNA Index System (CoDIS) that gathers data on a number of STRs.
By establishing the number of repeats of a given locus, law enforcement officials can differentiate individuals based on the repeat length of these alleles.
CoDIS uses a set of 20 loci that are tested together. As you would imagine, people are bound to have the same alleles of certain loci, especially if they were related. The use of 20 different loci makes it statistically improbable that 2 different people could be confused with each other.
Think about this in terms of physical traits. As you increase the number of physical traits used to describe someone, you are less likely to confuse that person with someone else based on those combinations of traits.
Using the CoDIS loci increases the stringency since there are many alleles for each locus.
How DNA Profiling is Done
At a crime scene, scant evidence in the form of a few cells found within bodily fluids or stray hairs can be enough to use as DNA evidence. DNA is extracted from these few cells and amplified by PCR using the specific primers that flank the STRs used in CoDIS.
Amplified DNA will be separated by gel electrophoresis and analyzed. Size reference standards and samples from the crime scene and the putative suspects would be analyzed together.
In a paternity test, samples from the mother, the child, and the suspected father would be analyzed in the same manner. A simple cheek swab will supply enough cells for this test.
Typically as mentioned above many STRs are analyzed at once during genetic profiling.
Watch this lecture video to learn how this is carried out.
This method while most well known for use in crime scenes has a wide variety of applications beyond that- from establishing paternity, matching organ donors to recipients, identifying victims of catastrophes (tsunamis and earthquakes), and identifying protected and endangered species to aid in conservation biology.
1.4 DNA Sequencing
DNA sequencing is most often accomplished using a procedure referred to by one of the following names:
- Sanger sequencing
- Di-deoxy sequencing
- Chain termination sequencing
Each of these refers to the same method developed by Fred Sanger in the 1970s.:
-
- the use of di-deoxy base incorporation in a polymerization reaction
- leads to the termination of the primer extension
Principle of Sanger Sequencing
It helps to understand the principle of sequencing by learning how it used to be carried out when first discovered.
The basic steps involved
- annealing a primer 5′ to a region of DNA we would like to sequence.
- The primer is extended (i.e. with DNA polymerase and the four dNTPs).
- However, a small concentration of di-deoxy bases is included in the reaction mix.
The ddNTPs are monomers that are missing a hydroxyl group (–OH) at the site at which another nucleotide usually attaches to form a chain. When a dideoxynucleotide is incorporated into a DNA strand, DNA synthesis stops.

Watch this visual demonstrating chain termination
4. Four PCR mixes are set up, each containing stocks of normal nucleotides plus one dideoxynucleotide (ddATP, ddTTTP, ddCTPor ddGTP) that was made radioactive.
5. As a typical PCR will generate over 1 billion DNA molecules, each PCR mix should generate all the possible terminating fragments for that particular base, especially if only a small amount of ddNTP is used.
This results in multiple short strands of replicated DNA that are each terminated at a different point during replication.
6. When the fragments are separated using gel electrophoresis, the multiple newly replicated DNA strands form a ladder because of the differing sizes. Because the ddNTPs are labeled, each band on the gel reflects the size of the DNA strand and the ddNTP that terminated the reaction. The base sequence can be determined by ordering fragments according to length and ‘reading’ the gel or ladder from the bottom up.
Click through the interactive at the link below that explains the process of Sanger Sequencing
This process has since been automated eliminating the need for high amounts of radioactivity or dealing with cumbersome gels. Instead, the ddNTPs are fluorescently labeled in different colors.
Template DNA could be sequenced in a single tube, containing all the required components, including all four dideoxynucleotides! That’s because the fluorescence detector in the sequencing machine separately sees all the short ddNTP-terminated fragments as they move through the electrophoretic gel.
After the sequencing reactions, the reaction products are electrophoresed on an ‘automated DNA sequencer’. UV light excites the migrating dye-terminated DNA fragments as they pass through a detector. The color of their fluorescence is detected, processed and sent to a computer, generating a color-coded graph known as Chromatogram like the one below, showing the order (and therefore length) of fragments passing the detector and thus, the sequence of the strand.
 Image from https://www.genome.gov/genetics-glossary/DNA-Sequencing in Public Domain.
Second Generation and Next-generation Sequencing
The Sanger method of sequencing DNA is often called “first-generation” sequencing because they were the first to be developed. In the late 1990s, new methods, called second-generation sequencing methods, that were faster and cheaper, began to be developed.
We will learn about these newer techniques later in the semester as they have become useful tools for analyzing genome-wide gene expression and studies into the regulation of gene expression.
Key Takeaways
- The lack of the second deoxy group on a dNTP making it ddNTP stops the incorporation of further nucleotides, this termination creates DNA lengths stopped at every nucleotide, this is central to further identifying each nucleotide.
- Using fluorescent labels, dideoxy sequencing can be automated allowing high-throughput methods which have been utilized to sequence entire genomes.
Terms:
- chromatogram: The visual output from a chromatograph. Usually a graphical display or histogram.
- dideoxynucleotide: Any nucleotide formed from a deoxynucleotide by loss of an a second hydroxy group from the deoxyribose group
References and Attributions
This chapter contains material taken from the following CC-licensed content. Changes include rewording, removing paragraphs and replacing with original material, and combining material from the sources.
1. Bergtrom, Gerald, “Cell and Molecular Biology 4e: What We Know and How We Found Out” (2020). Cell and Molecular Biology 4e: What We Know and How We Found Out – All Versions. 13.
https://dc.uwm.edu/biosci_facbooks_bergtrom/13
2. Works contributed to LibreTexts by Kevin Ahern and Indira Rajagopal. LibreTexts content is licensed by CC BY-NC-SA 3.0. The entire textbook is available for free from the authors at http://biochem.science.oregonstate.edu/content/biochemistry-free-and-easy
3. “Amplifying DNA – The Polymerase Chain Reaction” by LibreTexts is licensed under CC BY-SA.
4. “Analysis of STRs” by LibreTexts is licensed CC BY-NC-SA. https://bio.libretexts.org/@go/page/72191
