3 Chapter 3. Natural and Anthropogenic Drivers of Climate Change
In order to understand impacts of human activity on global weather and climate, we need to first have an understanding of what natural factors contribute to changes in the climate on a global scale. At previous times in Earth’s long history, it’s been warmer than it is now (during the time of the dinosaurs, for example, when no ice caps or ice sheets were present), and it’s been cooler than it is now (during various ice ages, for example). So, climate changes can obviously happen with or without human influence. Natural drivers of climate changes include variations in Sun’s radiation (energy), changes in the Earth’s orbit, variations in ocean cycles, and variations in volcanic activity.
Sun’s radiation (energy)
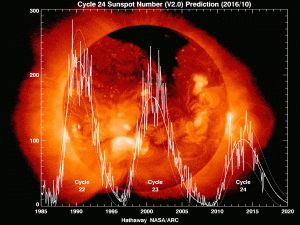
The sun is the largest external source of energy for the earth. Our planet wouldn’t be inhabitable without warmth from the sun! However, the energy output from the sun isn’t constant. The sun is a “variable star,” which means that its brightness changes in time. When the sun emits more energy, the earth warms up a bit. When the sun emits less energy, the Earth cools a bit. In 1843, scientists discovered a roughly 11-year cycle in solar output by tracking sunspot activity (these cycles have since been reconstructed all the way back to 1755). During this cycle, the amount of energy emitted by the sun varies, as does its sunspot activity. When the sun has lots of sunspots (dark areas) and bright spots (called faculae), solar energy output increases overall. On the other hand, when few sunspots and faculae are present, solar energy output decreases overall. The variation in solar energy during these cycles isn’t large, however, only varying by about 0.1 percent.
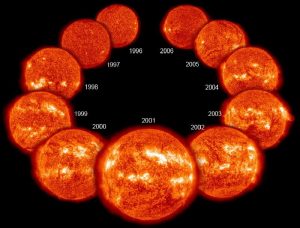
Solar energy output also varies gradually on longer time scales. In other words, its peak intensity during each solar cycle is not the same. During most of the 20th century, the sun demonstrated a gradual increase in intensity, but starting around 1970, the intensity of solar output has gradually decreased. That means long-term solar trends favored a slight warming of the earth from the early 1900s up until about 1970, but have favored a slight cooling of the earth overall since then.
In 1894 the English astronomer Edward Walter Maunder pointed out that very few sunspots had been observed between 1645 and 1715. However, most of Maunder’s fellow astronomers blamed the lack of sunspots on haphazard and sporadic observations of the Sun by 17th- and 18th-century astronomers. In 1976 American astronomer John Allen Eddy used extensive historical data to show that 17th- and 18th-century astronomers had indeed been careful and diligent observers of the Sun. Eddy also conducted detailed analysis of levels of carbon-14 (a radioactive isotope whose abundance increases during periods of low solar activity) in tree rings to confirm that during two distinct historical periods sunspot activity was greatly decreased. Eddy dubbed the conspicuous solar calm that lasted from 1645 to 1715 the Maunder minimum, after Maunder. Eddy also examined evidence of an earlier low sunspot interval between 1450 and 1540, which he called the Spörer minimum in honor of the 19th-century German scientist Gustav Spörer, another early observer of the irregularities.
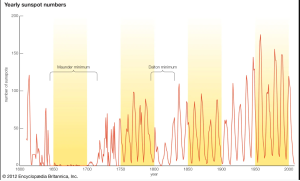
The Maunder minimum coincided with the coldest part of the “Little Ice Age” (c. 1500–1850) in the Northern Hemisphere, when the Thames River in England froze over during winter, Viking settlers abandoned Greenland, and Norwegian farmers demanded that the Danish king recompense them for lands occupied by advancing glaciers. The physical mechanism that explains how a drastic change in solar activity affects Earth’s climate is unknown, and a single episode, however suggestive, does not prove that lower sunspot numbers produce cooling. However, if real, the phenomenon may indicate that the Sun can influence the climate on Earth with even slight fluctuations.
Changes in Earth’s Orbit (Milankovitch Cycles)
Natural global warming, and cooling, is considered to be initiated by Milankovitch cycles. These orbital and axial variations influence the initiation of climate change in long-term natural cycles of ‘ice ages’ and ‘warm periods’ known as ‘glacial‘ and ‘interglacial‘ periods.
The Milankovitch cycles are caused by changes in the shape of the Earth’s orbit around the sun, the tilt of the Earth’s rotation axis, and the wobble of Earth’s axis. The mass and movement of the other planets in our solar system actually affect the Earth orbit just as our planetary mass similarly affects their orbits. As the Earth’s orbit changes, so too does the amount of sunlight that falls on different latitudes and in seasons. The amount of sunlight received in the summer at high northern latitudes appears to be especially important to determining whether the Earth is in an ice age or not. When the northern hemisphere summer sun is strong, the Earth tends to be in a warm period. When it is weak we tend to be in an ice age.
There are three general factors that determine the forcing changes in the Milankovitch cycles.
- Eccentricity, the elliptical changes in the earth’s orbit around the sun
- Obliquity, the tilt of Earth’s axis toward and away from the sun
- Precession, the wobble of Earth’s axis toward and away from the sun
The two terms necessary to understand the Milankovitch cycles are perihelion and aphelion. Perihelion is when Earth spends more time in close proximity to the sun, or in the case of the tilt and wobble cycles, when the northern hemisphere land mass facing the sun is closest to the sun, causing warming.
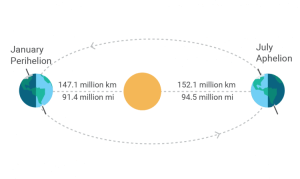
Figure 4 Details.
Current position of Perihelion and Aphelion. Summer is warmer in southern hemisphere then in northern hemisphere, therefore conditions for growth of glaciers in northern hemisphere are favorable. (Source: NASA)
Aphelion is the opposite, when the Earth spends more time during the year away from the sun, or in the case of the tilt and wobble cycles, when the northern hemisphere land mass facing the sun is further from the sun, causing cooling.
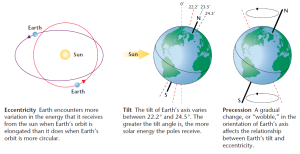
The Eccentricity Cycle (Elliptical Cycle)
This is the longest cycle that occurs about every 100,000 years. When the orbit is elliptical Earth spends less time close to the sun in the span of a single year. This means Earth gets less solar energy on an annual basis, and tends to cool, which is favorable for glacier formation.
The ice sheets melt when the ice sheet is exposed to more summer sunlight. This happens when the northern summer aligns with the perihelion. The Earth/Sun perihelion depends on how elliptical the orbit is. The more elliptical orbit, the closer the perihelion.
The Obliquity Cycle (Axial Tilt)
The Axial Tilt, or obliquity, varies to the plane of the Earth’s orbit. This tilt, now around 23.5o varies between 21.5o and 24.5o degrees. That means it can change up to 3 degrees over a period of 41,000 years. Increased obliquity can cause summers to be warmer and winters to be colder. So, when Earth’s orbit is elliptical and the northern hemisphere, which is mostly land mass, is tilted toward the sun, in a few thousand years glaciers can melt away. As Earth attains a more circular orbit, and the combined effects of the tilt and wobble work together in their natural cycles, the Earth has a chance to cool again and go back into an ice age. Conversely, decreased obliquity can cause cooler summers that in combination with other factors can help push the climate system into ice ages. Earth is currently in a decreasing tilt phase, which under normal circumstances, without the excess GHG’s, would cause cooling of the climate.
The Precession Cycle (Wobble)
The precession (wobble) cycle occurs every 21,000 years. This gyroscopic wobble of the Earth’s axis is driven by tidal forces which are influenced by the Sun and the Moon. The wobble can cause a difference in the types of seasons one polar hemisphere will experience over the other. The hemisphere at perihelion (closest to the sun) will enjoy an increase in summer solar radiation but a cooler winter, while the opposite hemisphere will have a warmer winter and a cooler summer.
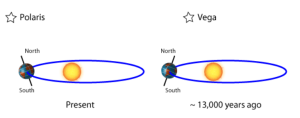
Figure 6 Details.
Precession Cycle (Wobble) shows present and past seasons on Earth. 13,000 years ago Northern hemisphere was in perihelion when summers were warmer and helped melt the glaciers and end Ice Age. (Source: NASA)
Geologic activity and climate change
Volcanoes
Volcanoes can impact climate change. During major explosive eruptions huge amounts of volcanic gas, aerosol droplets, and ash are injected into the stratosphere. Injected ash falls rapidly from the stratosphere — most of it is removed within several days to weeks — and has little impact on climate change. But volcanic gases like sulfur dioxide can cause global cooling, while volcanic carbon dioxide, a greenhouse gas, has the potential to promote global warming.
The most significant climate impacts from volcanic injections into the stratosphere come from the conversion of sulfur dioxide to sulfuric acid, which condenses rapidly in the stratosphere to form fine sulfate aerosols. The aerosols increase the reflection of radiation from the Sun back into space, cooling the Earth’s lower atmosphere or troposphere.
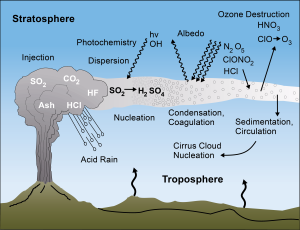
Figure 7 Details.
Volcanic gases react with the atmosphere in various ways; the conversion of sulfur dioxide (SO2) to sulfuric acid (H2SO4) has the most significant impact on climate. (Source: USGS)
Several eruptions during the past century have caused a decline in the average temperature at the Earth’s surface of up to half a degree for periods of one to three years. The climactic eruption of Mount Pinatubo on June 15, 1991, was one of the largest eruptions of the twentieth century and injected a 20-million ton sulfur dioxide cloud into the stratosphere at an altitude of more than 20 miles. The Pinatubo cloud was the largest sulfur dioxide cloud ever observed in the stratosphere since the beginning of such observations by satellites in 1978. It caused what is believed to be the largest aerosol disturbance of the stratosphere in the twentieth century, though probably smaller than the disturbances from eruptions of Krakatau in 1883 and Tambora in 1815. Consequently, it was a standout in its climate impact and cooled the Earth’s surface for three years following the eruption, by as much as 1.3 degrees F at the height of the impact.
The large 1783-1784 Laki fissure eruption in Iceland released a staggering amount more sulfur dioxide than Pinatubo (approximately 120-million ton vs. 20). Although the two eruptions were significantly different in length and style, the added atmospheric SO2 caused regional cooling of Europe and North America by similar amounts for similar periods of time.
Plate Tectonics
The outer layers of the Earth are broken into about a dozen large tectonic plates, extending to about 60-100 miles (100-160 km) beneath the surface. Each of these plates may be made of oceanic crust and lithosphere, continental crust and lithosphere, or an oceanic plate with a continent occupying part of the area of the plate. Plate tectonics describes processes associated with the movement of these plates along three different types of boundaries: divergent, convergent, and transform. At divergent boundaries the plates move apart from one another, and molten rock (magma) rises from the mantle to fill the space between the diverging plates. This magma makes long ridges of volcanoes along a midocean ridge system that accounts for most of the volcanism on the planet. These volcanoes emit huge quantities of carbon dioxide (CO2) and other gases when they erupt.
There have been times in the history of Earth that midocean ridge volcanism was very active, producing huge quantities of magma and CO2 gas, and other times when the volcanism is relatively inactive. The large quantities of magma and volcanism involved in this process have ensured that variations in midocean ridge magma production have exerted strong controls on the amount of CO2 in the atmosphere and ocean, and thus, are closely linked with climate. Periods of voluminous magma production are correlated with times of high atmospheric CO2, and globally warm periods. These times are also associated with times of high sea levels, since the extra volcanic and hot oceanic material on the seafloor takes up extra volume and displaces the seawater to rise higher over the continents. This rise in sea levels in turn buried many rocks that are then taken out of the chemical weathering system, slowing down reactions between the atmosphere and the weathering of rocks. Those reactions are responsible for removing large quantities of CO2 from the atmosphere, so the rise in sea level further promotes global warming during periods of active seafloor volcanism.
Convergent boundaries are places where two plates are moving toward each other or colliding. Most plate convergence happens where an oceanic plate is pushed or subducted beneath another plate, either oceanic or continental, forming a line of volcanoes on the overriding plate. This line of volcanoes is known as a magmatic arc, and specifically as an island arc if built on oceanic crust or an Andean arc if built on continental crust. When continents on these plates collide, the rocks that were deposited along their margins, typically underwater, are uplifted in the collision zone and exposed to weathering processes. The weathering of these rocks, particularly the limestone and carbonate rocks, causes chemical reactions where the CO2 in the atmosphere reacts with the products of weathering, and forms new carbonate (CaCO3) that gets deposited in the oceans. Continental collisions are thus associated with the overall removal of CO2 from the atmosphere and help promote global cooling.
Transform margins do not significantly influence global climate since they are not associated with large amounts of volcanism, nor do they uplift large quantities of rock from the ocean.
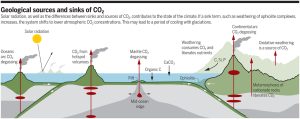
Perhaps the most fundamental, direct link between plate tectonics and climate comes from the slowly evolving global distribution of continental blocks and fragments. As tectonic plates move, so do the continents and this redistribution of landmass has an important effect on the Earth’s energy balance via differences in the albedos (reflectivities) and thermal properties of land versus ocean. Changes in the latitudinal distribution of land can have a significant effect on zonally-averaged net radiation balance. For example, an Earth with polar continents covered by perennial snow and ice will have higher surface albedo than an Earth with a polar geography dominated by open water. Because the need for poleward heat transport (the ultimate driver of winds and ocean currents) is determined by the latitudinal net radiation gradient, major changes in the distribution of continents are likely to have significant climatic consequences.
The timescale of variations in global CO2 related to changes in plate tectonics are slow, and they fall under the realm of causing very long-term climate changes, in cycles ranging from millions to tens of millions of years.
Anthropogenic Drivers of Climate Change
The natural drivers of climate change don’t tell the whole climate-change story, because they can’t account for the observed temperature changes that have occurred since the late 1800s, especially the warming in the last 50 years. So, there must be other factors, such as human activities, that can affect climate on a global scale.
The human-caused changes to the climate are referred to as “anthropogenic climate change“. A major component of anthropogenic climate change is global warming, which refers to a gradual warming of the earth caused by an unnatural (human-induced) increase of the greenhouse effect, as concentrations of greenhouse gases increase primarily from the burning of fossil fuels (coal, oil, and natural gas).
The greenhouse gases, such as water vapor, carbon dioxide, methane, and nitrous oxide absorb and emit infrared radiation, and cause warming the planet by the process called the greenhouse effect.
Without greenhouse gases, Earth would be much colder; its average temperature would be nearly 30o C (60o F) lower! The greenhouse effect is natural, and the warming it causes is essential to sustaining life as we know it on Earth. But, since the Industrial Revolution in the late 1700s, humans have been burning carbon-rich, fossil fuels like coal, oil, and natural gas on a large scale, releasing additional carbon dioxide into the atmosphere. Emissions of carbon dioxide grew very slowly and gradually in the 1800s, but with population growth and still a heavy reliance on fossil fuels today, global carbon dioxide emissions have grown more than ten times from 1900 through recent years. The percentage of the world’s energy coming from fossil fuels has dropped a bit in recent decades with the growth of nuclear power, wind, solar, and other renewable energy sources, but still remains at nearly 80 percent.
Before the Industrial Revolution, the atmospheric concentration of carbon dioxide was around 280 parts per million, but through the burning of fossil fuels like coal, oil, and natural gas, humans have added carbon dioxide to the atmosphere. The concentration of carbon dioxide in the atmosphere now exceeds 400 parts per million, and you can see the upward trend in atmospheric carbon-dioxide concentration since the late 1950s in the data from the Mauna Loa Observatory in Hawaii below.
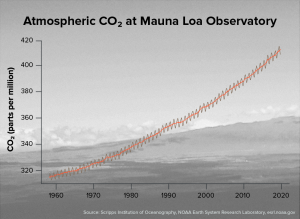
Increasing carbon-dioxide concentration gradually results in a stronger greenhouse effect, which is causing the planet to warm additionally. The anthropogenic increase in the greenhouse effect in particular helps explain Earth’s warming since 1970s, during a time when the major natural drivers of climate change have favored a slight cooling.
Swedish scientist Svante Arrhenius noted in 1903 that the burning of carbon-rich coal would likely lead to a warming of the planet because of increased carbon dioxide concentrations. His ideas were largely ignored at the time, not because other scientists doubted the greenhouse effect but because of incomplete knowledge of Earth’s carbon cycle.
While the concentration of atmospheric carbon dioxide varies naturally, studies of historical atmospheric composition based on air bubbles trapped in ice cores reveal that current-day concentrations of carbon dioxide are unprecedented in last 800,000 years. As you can see from the graph below, carbon dioxide concentrations largely remained between 180 parts per million and 300 parts per million for hundreds of thousands of years…until about 1950. Since then, carbon dioxide concentrations have continued to climb, and are now 421.95 (on March 9, 2023) parts per million thanks in large part to the burning of fossil fuels.
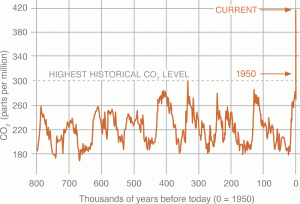
Figure 10 Details.
Carbon-dioxide concentration in the Earth’s atmosphere. Recent data are from direct observations at Mauna Loa. Data before the 1950s are from reconstructions based on air bubbles trapped in ice cores. (Source: NASA)
In addition to transportation and industry, agriculture is another major contributor of an increase in greenhouse gasses. Combined effects of agricultural preproduction (fertilizers, animal feed, etc.), production (land cover change and degradation, agribusiness practices –cattle ranching, soybean farming, and plantation — deforestation, and postproduction (processing, packaging, transportation, refrigeration, retail services, consumer waste) add about 30% of total greenhouse gas emissions.
While increased carbon dioxide concentrations from human activities get a lot of attention when it comes to anthropogenic climate change, human impacts on the climate don’t stop there. Carbon dioxide isn’t the only greenhouse gas that has increased in concentration. Atmospheric concentrations of methane have more than doubled since pre-industrial times, primarily from decomposition of organic matter, such as carbon-based garbage in landfills, agricultural and biological processes (livestock digestion and rice cultivation are two examples), and the production and distribution of fossil fuels. Nitrous oxide has also increased in concentration since pre-industrial times, mostly through agriculture — adding nitrogen to soils, which eventually gets released into the atmosphere — and through other various industrial activities that involve burning solid waste and fossil fuels.
While methane and nitrous oxide concentrations have increased from human activity, their concentrations remain much smaller than the concentration of carbon dioxide. However, each molecule of methane and nitrous oxide is actually more efficient at absorbing and emitting infrared radiation than is carbon dioxide. Hence, while their concentrations are extremely small, these other greenhouse gases can’t be ignored in studying the climate change.
Not all aspects of human activity, and the burning of fossil fuels in particular, lead to warming on a global scale. Burning coal, oil, and natural gas is also a source of air pollution, which includes aerosols (small solid particles of soot, ash, etc.). Additionally, sulfur compounds, especially sulfur dioxide, can react with other substances in the atmosphere to form small liquid drops which can serve as cloud condensation nuclei. The net effect of these aerosols is to increase the amount of solar radiation that gets scattered back to space, which reduces the amount absorbed by Earth’s surface. So, the aerosol byproducts of industrial activities actually favor a cooling of the planet.
The only exception among the aerosols is a black carbon, which contributes to warming the Earth. Black carbon is a potent climate-warming component of particulate matter formed by the incomplete combustion of fossil fuels, wood and other fuels. Complete combustion would turn all carbon in the fuel into carbon dioxide (CO2), but combustion is never complete and CO2, carbon monoxide, volatile organic compounds, and organic carbon and black carbon particles are all formed in the process.
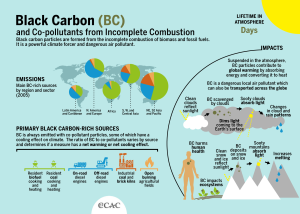
Black carbon is a short-lived climate pollutant with a lifetime of only days to weeks after release in the atmosphere. During this short period of time, black carbon can have significant direct and indirect impacts on the climate, glacial regions, agriculture and human health (see Figure 12). Several studies have demonstrated that measures to prevent black carbon emissions can reduce near-term warming of the climate, increase crop yields and prevent premature deaths.
Scientists estimate that during the first half of the 20th century, much of the human-induced warming from increasing greenhouse gases was actually offset by decreased incoming solar radiation because of aerosols. But, with many governments more heavily regulating air pollution by the 1970s, aerosols are having less of a cooling effect in recent decades. The reduction in sulfur dioxide in the atmosphere is directly beneficial to human health, but it has increased the rate of earth’s warming due to human activities, as greenhouse gas emissions have become the dominant factor.
This Chapter is compiled from following sources: National Snow and Ice Data Center, United States Geological Survey, Encyclopedia Britannica, S. Seman of PSU’s Creative Commons Attribution, Open Source Systems, Climate & Clean Air Coalition.
