
2 Student Data

Enrollment History • Student Characteristics • Residence Life • Retention & Graduation Rates • Admissions • Financial Aid • Degrees Awarded
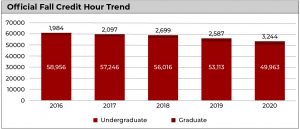
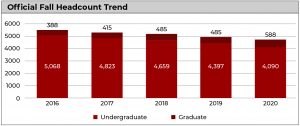
Student Enrollment History
| Year | 2016-17 | 2017-18 | 2018-19 | 2019-20 | 2020-21 | |||||
| FALL SEMESTER | Headcount | Credit Hours | Headcount | Credit Hours | Headcount | Credit Hours | Headcount | Credit Hours | Headcount | Credit Hours |
| Undergraduate-PT | 1,757 | 12,327 | 1,605 | 11,335 | 1455 | 10,115 | 1,298 | 8,855 | 1,189 | 8,024 |
| Undergraduate-FT | 3,311 | 46,629 | 3,218 | 45,911 | 3,204 | 45,902 | 3,099 | 44,258 | 2,901 | 41,939 |
| Undergrad-Total | 5,068 | 58,956 | 4,823 | 57,246 | 4,659 | 56,016 | 4,397 | 53,113 | 4,090 | 49,963 |
| Graduate-PT | 359 | 1,734 | 378 | 1,746 | 404 | 1,900 | 397 | 1,769 | 468 | 2,076 |
| Graduate-FT | 29 | 250 | 37 | 351 | 81 | 799 | 88 | 818 | 120 | 1,169 |
| Graduate-Total | 388 | 1,984 | 415 | 2,097 | 485 | 2,699 | 485 | 2,587 | 588 | 3,244 |
| IUS TOTAL | 5,456 | 60,940 | 5,238 | 59,343 | 5,144 | 58,715 | 4,882 | 55,700 | 4,678 | 53,207 |
| FT Equivalent | 4,178 | 4,078 | 4,072 | 3,864 | 3,736 | |||||
| SPRING SEMESTER | Headcount | Credit Hours | Headcount | Credit Hours | Headcount | Credit Hours | Headcount | Credit Hours | Headcount | Credit Hours |
| Undergraduate-PT | 1,641 | 11,242 | 1,468 | 10,168 | 1,437 | 9,456 | 1,202 | 7,983 | ||
| Undergraduate-FT | 2,936 | 41,575 | 2,853 | 40,901 | 2,797 | 40,063 | 2,739 | 39,412 | ||
| Undergrad-Total | 4,577 | 52,817 | 4,321 | 51,069 | 4,234 | 49,519 | 3,941 | 47,395 | ||
| Graduate-PT | 352 | 1,651 | 360 | 1,621 | 418 | 1,848 | 407 | 1,814 | ||
| Graduate-FT | 23 | 209 | 33 | 306 | 71 | 673 | 76 | 743 | ||
| Graduate-Total | 375 | 1,860 | 393 | 1,927 | 489 | 2,521 | 483 | 2,557 | ||
| IUS TOTAL | 4,952 | 54,677 | 4,714 | 52,996 | 4,723 | 52,040 | 4,424 | 49,952 | ||
| FT Equivalent | 3,754 | 3,645 | 3,616 | 3,479 | ||||||
| SUMMER SEMESTER | Headcount | Credit Hours | Headcount | Credit Hours | Headcount | Credit Hours | Headcount | Credit Hours | Headcount | Credit Hours |
| Undergraduate-PT | 1,890 | 9,422 | 1,820 | 8,907 | 1,713 | 8,393 | 1,622 | 8,215 | ||
| Undergraduate-FT | 148 | 2,000 | 150 | 2,089 | 115 | 1,559 | 135 | 1,846 | ||
| Undergrad-Total | 2,038 | 11,422 | 1,970 | 10,996 | 1,828 | 9,952 | 1,757 | 10,061 | ||
| Graduate-PT | 268 | 1,237 | 282 | 1,278 | 310 | 1,397 | 370 | 1,591 | ||
| Graduate-FT | 28 | 303 | 40 | 420 | 68 | 769 | 90 | 1,047 | ||
| Graduate-Total | 296 | 1,540 | 322 | 1,698 | 378 | 2,166 | 460 | 2,638 | ||
| IUS TOTAL | 2,334 | 12,962 | 2,292 | 12,694 | 2,206 | 12,118 | 2,217 | 12,699 | ||
| FT Equivalent | 954 | 945 | 934 | 1,000 | ||||||
* Dual credit students removed from enrollment data.
* IU Southeast’s graduate fte calculation considers a full-time load of 8 credit hours.
Student Characteristics
| Undergraduate Enrollment by School | |||||||
| Enrollment | Gender | ||||||
| School | FT | PT | %FT | F | M | %F | Total |
| Advising Center for Exploratory Students | 174 | 45 | 79.5% | 138 | 81 | 63.0% | 219 |
| Health Phys Ed & Recreation | 17 | 6 | 73.9% | 4 | 19 | 17.4% | 23 |
| Non-Degree | 14 | 83 | 14.4% | 58 | 39 | 59.8% | 97 |
| School of Arts & Letters | 398 | 216 | 64.8% | 378 | 236 | 61.6% | 614 |
| School of Business | 543 | 300 | 64.4% | 378 | 465 | 44.8% | 843 |
| School of Education | 346 | 51 | 87.2% | 313 | 84 | 78.8% | 397 |
| School of Natural Sciences | 509 | 221 | 69.7% | 372 | 358 | 51.0% | 730 |
| School of Nursing | 291 | 95 | 75.4% | 349 | 37 | 90.4% | 386 |
| School of Social Sciences | 609 | 172 | 78.0% | 532 | 249 | 68.1% | 781 |
| Grand Total | 2,901 | 1,189 | 2,522 | 1,568 | 4,090 | ||
| % of Total | 70.9% | 29.1% | 61.7% | 38.3% | |||
| Graduate Enrollment by School | |||||||
| Enrollment | Gender | ||||||
| School | FT | PT | %FT | F | M | %F | Total |
| Arts & Letters Graduate | 2 | 2 | 50.0% | 2 | 2 | 50.0% | 4 |
| Liberal Studies Graduate | 8 | 26 | 23.5% | 23 | 11 | 67.6% | 34 |
| Non-Degree | – | 2 | 0.0% | 2 | – | 100.0% | 2 |
| Liberal Studies Total | 8 | 28 | 22.2% | 25 | 11 | 69.4% | 36 |
| Business Graduate | 49 | 129 | 27.5% | 62 | 116 | 34.8% | 178 |
| Education Graduate | 24 | 103 | 18.9% | 93 | 34 | 73.2% | 127 |
| Non-Degree | 15 | 176 | 7.9% | 155 | 36 | 81.2% | 191 |
| Education Total | 39 | 279 | 12.3% | 248 | 70 | 78.0% | 318 |
| Natural Sciences Graduate | – | 6 | 0.0% | 5 | 1 | 83.3% | 6 |
| Nursing Graduate | – | 14 | 0.0% | 14 | – | 100.0% | 14 |
| Social Sciences Graduate | 22 | 10 | 68.8% | 19 | 13 | 59.4% | 32 |
| Grand Total | 120 | 468 | 20.4% | 375 | 213 | 63.8% | 588 |
| % of Total | 20.4% | 79.6% | 63.8% | 36.2% | |||
| Enrollment by Home County (Service Area) | ||||
| County | UG | % UG | Graduate | % Graduate |
| Clark | 964 | 17.7% | 113 | 19.3% |
| Crawford | 38 | 0.7% | 3 | 0.5% |
| Floyd | 871 | 16.0% | 107 | 18.3% |
| Harrison | 275 | 5.1% | 20 | 3.4% |
| Jackson | 51 | 0.9% | 21 | 3.6% |
| Jefferson | 56 | 1.0% | 10 | 1.7% |
| Orange | 39 | 0.7% | 4 | 0.7% |
| Scott | 100 | 1.8% | 6 | 1.0% |
| Washington | 162 | 3.0% | 10 | 1.7% |
| Other IN | 365 | 6.7% | 57 | 9.7% |
| Bullitt – KY | 70 | 1.3% | 9 | 1.5% |
| Jefferson – KY | 870 | 16.0% | 191 | 32.6% |
| Meade – KY | 10 | 0.2% | 2 | 0.3% |
| Oldham – KY | 100 | 1.8% | 8 | 1.4% |
| Shelby – KY | 14 | 0.3% | 3 | 0.5% |
| Spencer – KY | 8 | 0.1% | 2 | 0.3% |
| Trimble – KY | 2 | 0.0% | 0 | 0.0% |
| Other Non-Resident | 95 | 1.7% | 22 | 3.8% |
| Total | 4,090 | 588 | ||
| Undergraduate Age | |||
| Total | % of Total | Cum. Total | |
| 17 & Under | 52 | 1.27% | |
| 18-24 | 3,108 | 75.99% | 77.26% |
| 25-29 | 396 | 9.68% | 86.94% |
| 30-39 | 341 | 8.34% | 95.28% |
| 40 & Over | 193 | 4.72% | 100.00% |
| Total | 4,090 | ||
| UGRD Median Age = 21 | UGRD Mean Age = 23 |
| Graduate Age | |||
| Total | % of Total | Cum. Total | |
| 18 – 24 | 80 | 13.61% | |
| 25-29 | 159 | 27.04% | 40.65% |
| 30-39 | 178 | 30.27% | 70.92% |
| 40 & Over | 171 | 29.08% | 100.00% |
| Total | 588 | ||
| GRAD Median Age = 32 | GRAD Mean Age = 35 |
| Reciprocity by Level | ||||||
| Undergraduate (4,090) | Graduate (588) | Total | ||||
| N | % | N | % | total | % | |
| Resident Student | 2,860 | 61.4% | 356 | 73.4% | 3,216 | 82.7% |
| Reciprocity | 1,127 | 24.2% | 220 | 45.4% | 1,347 | 34.7% |
| Other Non-Resident | 103 | 2.2% | 12 | 2.5% | 115 | 1.4% |
| Ethnicity by School | ||||||||||
| American Indian/Alaska Native | Asian | Black/African American | Hispanic/Latino | Native Hawaiian/Pacific Island | NR-Alien | Two or More Races | White | Unknown | Grand Total | |
| Advising Ctr for Explor Stdnts | 2 | 1 | 13 | 12 | – | 1 | 10 | 178 | 2 | 219 |
| Health, Phys Ed & Recreation | – | – | 1 | 1 | – | – | – | 21 | – | 23 |
| Arts & Letters Undergraduate | 1 | 11 | 46 | 25 | – | 1 | 30 | 495 | 5 | 614 |
| Business Undergraduate | 1 | 16 | 43 | 52 | – | 5 | 31 | 690 | 5 | 843 |
| Education Undergraduate | – | 4 | 10 | 11 | 1 | – | 7 | 363 | 1 | 397 |
| Natural Science Undergraduate | 1 | 25 | 50 | 42 | – | 9 | 30 | 565 | 8 | 730 |
| Non-Degree Undergraduate | – | 4 | 11 | 1 | – | – | 6 | 75 | – | 97 |
| Nursing Undergraduate | 1 | 8 | 23 | 32 | – | 1 | 14 | 304 | 3 | 386 |
| Social Science Undergraduate | 1 | 6 | 74 | 45 | – | 3 | 43 | 604 | 5 | 781 |
| Total | 7 | 75 | 271 | 221 | 1 | 20 | 171 | 3,295 | 29 | 4,090 |
| % of Total | 0.17% | 1.83% | 6.63% | 5.40% | 0.02% | 0.49% | 4.18% | 80.56% | 0.71% | |
| Ethnicity by School (Graduate) | |||||||||||
| American Indian/Alaska Native | Asian | Black/African American | Hispanic/Latino | Native Hawaiian/Pacific Island | NR-Alien | Two or More Races | White | Unknown | Grand Total | ||
| Arts & Letters | Graduate | – | – | – | – | – | – | 1 | 3 | – | 4 |
| Interdisciplinary Studies | Graduate | – | 2 | 2 | 3 | – | 2 | 1 | 24 | – | 34 |
| Non-degree | – | – | – | – | – | – | 1 | 1 | – | 2 | |
| Total Interdisciplinary Studies | – | 2 | 2 | 3 | – | 2 | 2 | 25 | – | 36 | |
| Business | Graduate | 1 | 8 | 14 | 5 | – | 4 | 3 | 139 | 4 | 178 |
| Education | Graduate | 1 | 1 | 9 | 3 | 2 | 1 | 3 | 107 | – | 127 |
| Non-degree | – | 1 | 17 | 10 | – | – | 2 | 155 | 6 | 191 | |
| Total Education | 1 | 2 | 26 | 13 | 2 | 1 | 5 | 262 | 6 | 318 | |
| Natural Sciences | Graduate | – | – | – | – | – | – | – | 6 | – | 6 |
| School of Nursing | Graduate | – | – | 2 | – | – | – | 1 | 11 | – | 14 |
| School of Social Sciences | Graduate | – | – | 4 | – | – | – | – | 28 | – | 32 |
| Total | 2 | 12 | 48 | 21 | 2 | 7 | 12 | 474 | 10 | 588 | |
| % of Total | 0.34% | 2.04% | 8.16% | 3.57% | 0.34% | 1.19% | 2.04% | 80.61% | 1.70% | ||
NOTE: Education Non-Degree contains 25 dual credit teacher program students originally coded to the Administrative Tracking Group.
| Ethnicity by Gender | |||||||
| Undergraduate Ethnicity | Graduate Ethnicity | ||||||
| Ethnicity | F | M | Total | F | M | Total | Grand Total |
| American Indian/Alaska Native | 7 | – | 7 | – | 2 | 2 | 9 |
| Asian | 51 | 24 | 75 | 5 | 7 | 12 | 87 |
| Black/African American | 160 | 111 | 271 | 30 | 18 | 48 | 319 |
| Hispanic/Latino | 145 | 76 | 221 | 15 | 6 | 21 | 242 |
| Native Hawaiian/Pacific Island | 1 | – | 1 | 2 | – | 2 | 3 |
| NR-Alien | 12 | 8 | 20 | 6 | 1 | 7 | 27 |
| Two or More Races | 94 | 77 | 171 | 6 | 6 | 12 | 183 |
| White | 2,038 | 1,257 | 3,295 | 305 | 169 | 474 | 3,769 |
| Unknown | 14 | 15 | 29 | 6 | 4 | 10 | 39 |
| Total | 2,522 | 1,568 | 4,090 | 375 | 213 | 588 | 4,678 |
| % of Total | 61.66% | 38.34% | 63.78% | 36.22% | 0 | ||
| Undergraduate Class by Gender | |||||||
| F | M | %F | FT | PT | %FT | Total | |
| Freshman | 636 | 406 | 61.04% | 826 | 216 | 20.20% | 1,042 |
| Sophomore | 543 | 312 | 63.51% | 696 | 159 | 17.02% | 855 |
| Junior | 546 | 376 | 59.22% | 669 | 253 | 16.36% | 922 |
| Senior | 739 | 435 | 62.95% | 696 | 478 | 17.02% | 1,174 |
| Undergraduate Special | 58 | 39 | 59.79% | 14 | 83 | 0.34% | 97 |
| Total | 2,522 | 1,568 | 61.66% | 2,901 | 1,189 | 70.93% | 4,090 |
| % of Total | 61.66% | 38.34% | 70.93% | 29.07% | |||
Residence Life
| Residence Life Enrollment by School | |||||||
| FT | PT | % FT | F | M | % F | Total | |
| Advising Center for Exploratory Students | 23 | 2 | 92.0% | 17 | 8 | 68.0% | 25 |
| Arts & Letters | 24 | – | 100.0% | 16 | 8 | 66.7% | 24 |
| Business | 23 | – | 100.0% | 10 | 13 | 43.5% | 23 |
| Education | 29 | 1 | 96.7% | 26 | 4 | 86.7% | 30 |
| Natural Sciences | 31 | – | 100.0% | 17 | 14 | 54.8% | 31 |
| Nursing | 33 | – | 100.0% | 28 | 5 | 84.8% | 33 |
| Social Sciences | 51 | 1 | 98.1% | 37 | 15 | 71.2% | 52 |
| Total | 214 | 4 | 98.2% | 151 | 67 | 69.3% | 218 |
| % of Total | 98.2% | 1.8% | 69.3% | 30.7% | |||
| Residence Life Ethnicity by School | ||||||||||
| American Indian/ Alaska Native | Asian | Black/ African American | Hispanic/ Latino | Native Hawaiian/Pacific Island | NR-Alien | Two or More Races | White | Unknown | Total | |
| Advising Center for Exploratory Students | 1 | – | 3 | 2 | – | – | 2 | 17 | – | 25 |
| Arts & Letters | – | – | 4 | 1 | – | – | 1 | 18 | – | 24 |
| Business | – | – | 2 | 1 | – | – | 2 | 18 | – | 23 |
| Education | – | – | 3 | – | – | – | – | 27 | – | 30 |
| Natural Sciences | – | – | 1 | 3 | – | – | 1 | 24 | – | 31 |
| Nursing | – | – | 4 | 3 | – | 1 | 1 | 24 | – | 33 |
| Social Sciences | – | 2 | 10 | 4 | – | 1 | 2 | 33 | – | 52 |
| Total | 1 | 4 | 27 | 14 | 0 | 2 | 9 | 161 | 0 | 218 |
| % of Total | 0.5% | 1.8% | 12.4% | 6.4% | 0.0% | 0.9% | 4.1% | 73.9% | 0.0% | |
| Residence Life by County | ||
| Total | % of Total | |
| Clark | 13 | 6.0% |
| Crawford | 3 | 1.4% |
| Floyd | 7 | 3.2% |
| Harrison | 6 | 2.8% |
| Jackson | 12 | 5.5% |
| Jefferson | 4 | 1.8% |
| Orange | 3 | 1.4% |
| Scott | 1 | 0.5% |
| Washington | 6 | 2.8% |
| Other – IN | 95 | 43.6% |
| Bullitt (KY) | 1 | 0.5% |
| Jefferson (KY) | 50 | 22.9% |
| Meade (KY) | – | 0.0% |
| Oldham (KY) | 8 | 3.7% |
| Shelby (KY) | 2 | 0.9% |
| Spencer (KY) | – | 0.0% |
| Trimble (KY) | – | 0.0% |
| Other Non-IN | 7 | 3.2% |
| Total | 218 | |
| Residence Life Class Level by Gender | |||||
| F | M | FT | PT | Total | |
| Freshman | 94 | 36 | 126 | 4 | 130 |
| Sophomore | 34 | 7 | 41 | – | 41 |
| Junior | 16 | 13 | 29 | – | 29 |
| Senior | 7 | 11 | 18 | – | 18 |
| Non-Degree Undergraduate | – | – | – | – | 0 |
| Graduate | – | – | – | – | 0 |
| Total | 151 | 67 | 214 | 4 | 218 |
| % of Total | 69% | 31% | 98% | 2% | |
| Residence Life Ethnicity by Gender | |||
| F | M | Total | |
| American Indian/Alaska Native | 1 | – | 1 |
| Asian | 3 | 1 | 4 |
| Black/African American | 16 | 11 | 27 |
| Hispanic/Latino | 12 | 2 | 14 |
| Native Hawaiian/Pacific Island | – | – | 0 |
| NR-Alien | 2 | – | 2 |
| Two or More Races | 3 | 6 | 9 |
| White | 114 | 47 | 161 |
| Other | – | – | 0 |
| Total | 151 | 67 | 218 |
| % of Total | 69% | 31% | |
| Residents by Return Status | ||
| Fall 2020 Total | 218 | – |
| Resident in Fall 2019 & Spring 2020 | 68 | 31.19% |
| Resident in Fall 2019 Only | 6 | 2.75% |
| Resident in Spring 2020 Only | 9 | 4.13% |
| New Resident | 135 | 61.93% |
| Retention | ||||||
| 2017 | 2018 | 2019 | ||||
| Total Residents | 387 | 388 | 388 | |||
| Retained to Institution following Spring (1 semester or graduated) | 320 | 83% | 336 | 87% | 337 | 87% |
| Retained to Lodge following Spring (1 semester or graduated) | 308 | 80% | 306 | 79% | 318 | 82% |
| Retained to Institution following Fall (1 year or graduated) | 238 | 61% | 260 | 67% | 286 | 74% |
| “Retained to Lodge following Fall (1 year or graduated)” | 174 | 45% | 178 | 46% | 109 | 28% |
Retention and Graduation Rates
| Fall to Fall Gross Retention by Career: 2018 & 2019 | ||||||
| Fall 2019 to 2020 Retention | Fall 2018 to 2019 Retention | |||||
| All Students | Undergraduate | Graduate | All Students | Undergraduate | Graduate | |
| Enrolled | 4,882 | 4,397 | 485 | 5,144 | 4,659 | 485 |
| Enrolled in Second Fall | 2,736 | 2,512 | 224 | 2,817 | 2,587 | 230 |
| Graduated | 870 | 803 | 114 | 910 | 807 | 103 |
| Percent Retained | 74% | 74% | 70% | 72% | 73% | 69% |
| Cohort Fall to Fall Gross Retention: 2018 & 2019 | ||||
| Fall 2019 to 2020 Retention by Cohort | Fall 2018 to 2019 Retention by Cohort | |||
| First-time Freshmen | Transfers | First-time Freshmen | Transfers | |
| Enrolled | 948 | 317 | 1,012 | 315 |
| Enrolled in Second Fall | 575 | 224 | 584 | 214 |
| Graduated | 0 | 8 | 1 | 10 |
| Percent Retained | 61% | 73% | 58% | 71% |
| Historical Fall to Fall Gross Retention for All Students: 2015 – 2019 | |||||
| 2019 – 2020 | 2018 – 2019 | 2017 – 2018 | 2016 – 2017 | 2015 – 2016 | |
| Enrolled | 4,882 | 5,144 | 5,238 | 5,874 | 6173 |
| Enrolled in Second Fall | 2,736 | 2,817 | 2,916 | 3,161 | 3413 |
| Graduated | 870 | 910 | 938 | 855 | 942 |
| Percent Retained | 74% | 72% | 74% | 68% | 71% |
| Graduation Rates by First-Time, Full-Time, Bachelors-Seeking Freshman Cohort | |||||
| 2013 Cohort | 2012 Cohort | 2011 Cohort | 2010 Cohort | 2009 Cohort | |
| Original Number | 901 | 833 | 875 | 928 | 974 |
| Graduated in 4 Years | 19% | 17% | 14% | 12% | 8% |
| Graduated in 5 Years | 31% | 27% | 27% | 24% | 22% |
| Graduated in 6 Years | 36% | 33% | 32% | 31% | 28% |
NOTE: Enrollment was adjusted to exclude dual credit high school students starting in fall 2017.
NOTE: Retention is measured by retention to the IU Southeast campus only and considers any degree or certificate.
| Beginners | |||||
| Fall | 2020 | 2019 | 2018 | 2017 | 2016 |
| Applied | 2,549 | 2,831 | 2,795 | 2,273 | 2,177 |
| Admitted | 2,177 | 2,319 | 2,377 | 1,881 | 1,829 |
| Selectivity | 85.4% | 81.9% | 85.0% | 82.8% | 84.0% |
| Enrolled | 800 | 948 | 1,012 | 927 | 935 |
| Yield | 36.7% | 40.9% | 42.6% | 49.3% | 51.1% |
| Transfers | |||||
| Fall | 2020 | 2019 | 2018 | 2017 | 2016 |
| Applied | 646 | 702 | 736 | 865 | 912 |
| Admitted | 448 | 469 | 494 | 610 | 652 |
| Selectivity | 69.3% | 66.8% | 67.1% | 70.5% | 71.5% |
| Enrolled | 274 | 317 | 315 | 408 | 430 |
| Yield | 61.2% | 67.6% | 63.8% | 66.9% | 66.0% |
| Beginners | |||||
| SAT | *2020 | *2019 | *2018 | *2017 | 2016 |
| Verbal | |||||
| Average | 534 | 527 | 536 | 530 | 475 |
| 25th Percentile | 480 | 470 | 480 | 480 | 420 |
| 75th Percentile | 590 | 580 | 590 | 570 | 530 |
| Math | |||||
| Average | 522 | 508 | 517 | 509 | 464 |
| 25th Percentile | 490 | 460 | 470 | 470 | 410 |
| 75th Percentile | 560 | 560 | 560 | 550 | 510 |
| Percent with SAT Scores | 51.3% | 54.9% | 47.9% | 51.7% | 54.2% |
| ACT | |||||
| Average Composite | 20 | 20 | 20 | 20 | 20 |
| 25th Percentile | 17 | 17 | 17 | 17 | 17 |
| Median | 20 | 20 | 20 | 20 | 20 |
| 75th Percentile | 23 | 23 | 23 | 22 | 23 |
| Percent with ACT Scores | 56.6% | 59.1% | 64.7% | 62.2% | 57.3% |
*SAT 2017 Scale
Financial Aid
| 2019 | 2020 | # Change | % Change | |
| # of Students Receiving Aid | 4,446 | 4,307 | -139 | -3% |
| Type of Aid | 2019 | 2020 | # Change | % Change |
| Scholarships & Fellowships | 10,727,826 | 13,136,910 | 2,409,084 | 22% |
| Fee Remissions | 7,752,248 | 7,259,609 | (492,639) | -6% |
| Loans | 15,933,443 | 14,358,953 | (1,574,490) | -10% |
| Work Study | 201,773 | 194,571 | (7,202) | -4% |
| Grand Total | 34,615,290 | 34,950,043 | 334,753 | 1% |
| Source of Aid | 2019 | 2020 | # Change | % Change |
| Federal – Veterans Military | 678,442 | 612,460 | (65,982) | -10% |
| Federal – Other | 23,411,236 | 22,856,772 | (554,464) | -2% |
| State of Indiana | 5,778,444 | 5,680,980 | (97,464) | -2% |
| IU General Fund | 1,055,671 | 1,200,018 | 144,347 | 14% |
| IU foundation/IU Match | 70,700 | 72,353 | 1,653 | 2% |
| IU Endowment Treasurer | 78,991 | 71,984 | (7,007) | -9% |
| IU Foundation Endowment | 914,310 | 904,253 | (10,057) | -1% |
| Other IU Foundation | 5,000 | 1,500 | (3,500) | -70% |
| Other IU | 96,098 | 759,927 | 663,829 | 691% |
| Private External | 2,526,398 | 2,789,797 | 263,399 | 10% |
| Grand Total | 34,615,290 | 34,950,044 | 334,754 | 1% |
| 2015/2016 | 2016/2017 | 2017/2018 | 2018/2019 | 2019/2020 | |
| % Receiving Aid | 65.6% | 64.7% | 61.3% | 61.2% | 62.1% |
| Total Number of Students | 7,721 | 7,382 | 7,335 | 7,263 | 6,939 |
| $ Total Aid | 37,709,217 | 35,000,563 | 35,175,079 | 34,615,290 | 34,950,043 |
NOTE: Financial Aid data is based on fall, spring and summer disbursements and is snapshotted multiple times a year. Please contact the Office of Institutional Effectiveness with any questions.
IU Southeast Degrees Awarded (Fiscal Year)
(Fiscal Year includes August, December and May Graduates)
| School | 2012/2013 | 2013/2014 | 2014/2015 | 2015/2016 | 2016/2017 | 2017/2018 | 2018/2019 | 2019/2020 | Total |
| Office of Academic Affairs | |||||||||
| Basic Supervision CERT | 12 | 9 | 6 | 5 | 3 | 2 | 0 | 0 | 37 |
| General Studies AAGS | 10 | 7 | 3 | 0 | 1 | 3 | 1 | 0 | 25 |
| General Studies BGS | 129 | 103 | 99 | 76 | 65 | 60 | 7 | 0 | 539 |
| General Studies BGS-Online | 0 | 0 | 0 | 0 | 1 | 13 | 4 | 0 | 18 |
| SUB-TOTAL | 151 | 119 | 108 | 81 | 70 | 78 | 12 | 0 | 619 |
| School of Arts & Letters | |||||||||
| Applied Science BAS | 0 | 0 | 0 | 1 | 5 | 4 | 8 | 5 | 23 |
| Applied Science BAS-Online | 0 | 0 | 0 | 0 | 3 | 7 | 8 | 6 | 24 |
| Basic Supervision CERT | 0 | 0 | 0 | 0 | 0 | 0 | 1 | 0 | 1 |
| Communication AA | 6 | 6 | 2 | 1 | 0 | 1 | 0 | 0 | 16 |
| Communication BA | 33 | 27 | 32 | 28 | 43 | 34 | 30 | 36 | 263 |
| Core Competencies CRT | 0 | 0 | 0 | 0 | 0 | 0 | 2 | 16 | 18 |
| English AA | 0 | 0 | 1 | 1 | 0 | 0 | 0 | 0 | 2 |
| English BA | 36 | 25 | 26 | 25 | 22 | 22 | 21 | 21 | 198 |
| Fine Arts AA | 1 | 2 | 1 | 1 | 1 | 0 | 0 | 0 | 6 |
| Fine Arts BA | 11 | 18 | 20 | 1 | 7 | 2 | 8 | 4 | 71 |
| Fine Arts BFA | 6 | 5 | 11 | 7 | 6 | 11 | 30 | 25 | 101 |
| French BA | 1 | 0 | 5 | 0 | 2 | 0 | 3 | 2 | 13 |
| General Studies AAGS | 0 | 0 | 0 | 0 | 0 | 0 | 2 | 6 | 8 |
| General Studies BGS | 0 | 0 | 0 | 0 | 0 | 0 | 64 | 75 | 139 |
| General Studies BGS-Online | 0 | 0 | 0 | 0 | 0 | 0 | 14 | 12 | 26 |
| German BA | 2 | 0 | 3 | 3 | 2 | 1 | 1 | 0 | 12 |
| Individualized Major BA | 0 | 1 | 2 | 2 | 1 | 0 | 0 | 0 | 6 |
| Interdisciplinary Studies BIS | 0 | 0 | 0 | 0 | 0 | 0 | 3 | 8 | 11 |
| Multimedia Production CRT | 0 | 0 | 0 | 0 | 0 | 0 | 0 | 1 | 1 |
| Music AA | 1 | 1 | 0 | 0 | 0 | 0 | 0 | 0 | 2 |
| Music BA | 6 | 5 | 10 | 5 | 5 | 3 | 7 | 1 | 42 |
| Music BS | 0 | 0 | 0 | 1 | 1 | 4 | 5 | 3 | 14 |
| Philosophy BA | 5 | 3 | 5 | 4 | 1 | 1 | 2 | 5 | 26 |
| Second Language Competency CRT | 0 | 0 | 0 | 0 | 17 | 2 | 0 | 3 | 22 |
| Spanish AA | 0 | 0 | 3 | 0 | 0 | 0 | 0 | 0 | 3 |
| Spanish BA | 13 | 9 | 8 | 10 | 14 | 4 | 7 | 9 | 74 |
| Comp Studies Grad CRT – Online | 0 | 0 | 0 | 0 | 0 | 0 | 0 | 1 | 1 |
| SUB-TOTAL | 121 | 102 | 129 | 90 | 130 | 96 | 216 | 239 | 1,123 |
| School of Business | |||||||||
| Accounting PBC | 16 | 14 | 11 | 10 | 6 | 4 | 7 | 4 | 72 |
| Business AS | 19 | 26 | 11 | 7 | 9 | 2 | 0 | 0 | 74 |
| Business BSB | 146 | 158 | 152 | 170 | 182 | 187 | 162 | 165 | 1,322 |
| Business BSB-TSAP | 0 | 0 | 0 | 0 | 0 | 0 | 0 | 3 | 3 |
| Economics AA | 0 | 0 | 0 | 1 | 0 | 0 | 0 | 0 | 1 |
| Economics BA | 2 | 3 | 4 | 1 | 2 | 3 | 3 | 4 | 22 |
| Entrepreneurship CRT | 0 | 0 | 0 | 0 | 0 | 1 | 0 | 1 | 2 |
| Entrepreneurship PBC | 0 | 0 | 0 | 0 | 0 | 0 | 1 | 1 | 2 |
| Finance PBC | 1 | 0 | 1 | 0 | 1 | 0 | 0 | 0 | 3 |
| General Business PBC | 1 | 3 | 2 | 0 | 0 | 0 | 0 | 0 | 6 |
| Human Resources Management PBC | 5 | 0 | 3 | 5 | 1 | 0 | 1 | 2 | 17 |
| International Business PBC | 0 | 1 | 0 | 0 | 0 | 0 | 0 | 0 | 1 |
| Management PBC | 0 | 0 | 1 | 0 | 1 | 0 | 0 | 0 | 2 |
| Marketing PBC | 0 | 0 | 1 | 0 | 0 | 0 | 0 | 1 | 2 |
| Business Admin MBA | 64 | 62 | 47 | 41 | 35 | 42 | 42 | 30 | 363 |
| Management MS | 0 | 0 | 0 | 0 | 0 | 0 | 0 | 6 | 6 |
| Strategic Finance MSSF | 12 | 21 | 15 | 9 | 10 | 9 | 9 | 9 | 94 |
| Supply Chain & Info Mgt PBC | 0 | 0 | 0 | 0 | 0 | 1 | 0 | 0 | 1 |
| SUB-TOTAL | 266 | 288 | 248 | 244 | 247 | 249 | 225 | 226 | 1,993 |
| School of Education | |||||||||
| Chemistry Education BSED | 0 | 0 | 0 | 2 | 1 | 1 | 1 | 1 | 6 |
| Elementary Education BSED | 82 | 69 | 50 | 58 | 52 | 44 | 54 | 41 | 450 |
| Sec Ed Earth/Science BSED | 2 | 3 | 3 | 0 | 0 | 2 | 0 | 1 | 11 |
| Sec Ed Language Arts BSED | 12 | 5 | 6 | 11 | 15 | 15 | 6 | 6 | 76 |
| Sec Ed Life Science BSED | 4 | 3 | 3 | 1 | 1 | 0 | 1 | 0 | 13 |
| Sec Ed Math BSED | 13 | 5 | 8 | 8 | 4 | 5 | 5 | 3 | 51 |
| Sec Ed Physical Science BSED | 0 | 0 | 0 | 2 | 0 | 0 | 0 | 0 | 2 |
| Sec Ed SS-History Per BSED | 9 | 12 | 12 | 9 | 4 | 13 | 13 | 13 | 85 |
| Special Education BSED | 13 | 23 | 10 | 7 | 13 | 11 | 8 | 4 | 89 |
| Counseling MSED | 16 | 11 | 15 | 9 | 13 | 26 | 18 | 22 | 130 |
| Elementary Education MSED | 90 | 75 | 46 | 43 | 30 | 24 | 25 | 16 | 349 |
| Secondary Education MSED | 41 | 33 | 20 | 18 | 16 | 12 | 9 | 13 | 162 |
| SUB-TOTAL | 282 | 239 | 173 | 168 | 149 | 153 | 140 | 120 | 1,424 |
| School of Interdisciplinary Studies | |||||||||
| Digital Media GR CRT | 0 | 0 | 0 | 0 | 0 | 0 | 0 | 1 | 1 |
| Interdisciplinary Stds GR CRT | 0 | 0 | 0 | 0 | 2 | 4 | 5 | 5 | 16 |
| Interdisciplinary Studies MIS | 0 | 0 | 0 | 1 | 5 | 5 | 5 | 1 | 17 |
| Liberal Studies GR CRT | 0 | 5 | 5 | 3 | 0 | 0 | 0 | 0 | 13 |
| Liberal Studies MLS | 6 | 7 | 5 | 1 | 0 | 0 | 0 | 0 | 19 |
| Organztnl Ldrshp & Comm GR CRT | 0 | 0 | 0 | 0 | 0 | 0 | 0 | 1 | 1 |
| SUB-TOTAL | 6 | 12 | 10 | 5 | 7 | 9 | 10 | 8 | 67 |
| School of Natural Sciences | |||||||||
| Biology AA | 8 | 5 | 9 | 5 | 0 | 0 | 0 | 0 | 27 |
| Biology BA | 9 | 5 | 11 | 11 | 5 | 8 | 4 | 6 | 59 |
| Biology BS | 25 | 22 | 24 | 30 | 39 | 29 | 30 | 37 | 236 |
| Chemistry AA | 26 | 17 | 13 | 11 | 3 | 1 | 1 | 1 | 73 |
| Chemistry & Biology BA | 0 | 2 | 0 | 0 | 0 | 0 | 0 | 0 | 2 |
| Chemistry BA | 3 | 10 | 5 | 2 | 3 | 7 | 2 | 6 | 38 |
| Chemistry BS | 5 | 8 | 10 | 13 | 6 | 10 | 8 | 3 | 63 |
| Clinical Lab Science BS | 1 | 1 | 0 | 1 | 0 | 2 | 1 | 3 | 9 |
| Coding Technology CRT | 15 | 25 | 34 | 26 | 32 | 23 | 22 | 17 | 194 |
| Computer Science AS | 7 | 2 | 2 | 3 | 0 | 0 | 1 | 0 | 15 |
| Computer Science BS | 14 | 18 | 17 | 19 | 17 | 28 | 25 | 25 | 163 |
| Geosciences AA | 1 | 3 | 6 | 0 | 0 | 0 | 0 | 0 | 10 |
| Geosciences BA | 13 | 16 | 19 | 14 | 15 | 18 | 13 | 14 | 122 |
| Health Info Admin BS | 0 | 0 | 0 | 0 | 0 | 1 | 0 | 11 | 12 |
| Healthcare Documentation CRT | 0 | 0 | 0 | 0 | 1 | 3 | 5 | 1 | 10 |
| Informatics BS | 14 | 16 | 11 | 18 | 17 | 10 | 11 | 8 | 105 |
| Information Technology CRT | 5 | 4 | 8 | 10 | 4 | 5 | 4 | 3 | 43 |
| Mathematics AA | 2 | 3 | 6 | 2 | 1 | 0 | 0 | 0 | 14 |
| Mathematics BA | 0 | 1 | 3 | 2 | 1 | 6 | 3 | 1 | 17 |
| Mathematics BS | 7 | 7 | 8 | 10 | 5 | 8 | 3 | 9 | 57 |
| Med Transcription Tech CRT | 10 | 7 | 3 | 7 | 0 | 0 | 0 | 0 | 27 |
| Network Technology CRT | 0 | 0 | 0 | 0 | 0 | 0 | 1 | 0 | 1 |
| Physics AA | 0 | 1 | 1 | 0 | 0 | 1 | 0 | 0 | 3 |
| Physics BA | 0 | 0 | 0 | 0 | 0 | 2 | 1 | 2 | 5 |
| Sustainability CRT | 0 | 0 | 0 | 0 | 0 | 2 | 0 | 0 | 2 |
| Sustainability & Regeneration BA | 0 | 0 | 0 | 0 | 0 | 0 | 1 | 0 | 1 |
| Sustainability & Regeneration BS | 0 | 0 | 0 | 0 | 0 | 0 | 1 | 0 | 1 |
| SUB-TOTAL | 165 | 173 | 190 | 184 | 149 | 164 | 137 | 147 | 1,309 |
| School of Nursing | |||||||||
| Appld Hlth Sci BSAHS-Online | 0 | 0 | 0 | 0 | 0 | 0 | 0 | 2 | 2 |
| Nursing BSN | 54 | 42 | 47 | 48 | 44 | 38 | 30 | 39 | 342 |
| Nursing (RN-BSN) BSN | 19 | 28 | 28 | 17 | 21 | 18 | 22 | 6 | 159 |
| Nursing RN to BSN | 9 | 22 | 27 | 63 | 0 | 0 | 0 | 0 | 121 |
| Nursing RN to BSN-Online | 0 | 0 | 0 | 0 | 43 | 45 | 26 | 26 | 140 |
| Nursing MSN | 0 | 0 | 0 | 0 | 0 | 0 | 0 | 5 | 5 |
| SUB-TOTAL | 82 | 92 | 102 | 128 | 108 | 101 | 78 | 78 | 769 |
| School of Social Sciences | |||||||||
| Criminal Justice BS | 3 | 1 | 1 | 0 | 0 | 0 | 0 | 0 | 5 |
| Criminology & Crim Justice BS | 36 | 45 | 51 | 54 | 58 | 41 | 48 | 27 | 360 |
| Diversity/Intercultural CRT | 0 | 0 | 0 | 0 | 0 | 0 | 4 | 2 | 6 |
| European Affairs CRT | 0 | 0 | 0 | 0 | 0 | 1 | 1 | 0 | 2 |
| History AA | 0 | 0 | 1 | 0 | 0 | 0 | 0 | 0 | 1 |
| History BA | 10 | 10 | 6 | 8 | 7 | 7 | 7 | 3 | 58 |
| History BS | 0 | 0 | 0 | 0 | 0 | 2 | 9 | 3 | 14 |
| International Studies BA | 2 | 8 | 8 | 5 | 4 | 4 | 5 | 0 | 36 |
| Journalism AS | 0 | 0 | 0 | 0 | 0 | 0 | 0 | 0 | 0 |
| Journalism BA | 9 | 13 | 13 | 10 | 7 | 12 | 7 | 3 | 74 |
| Journalism/Media BA | 0 | 0 | 0 | 0 | 0 | 1 | 3 | 7 | 11 |
| Journalism/Media BS | 0 | 0 | 0 | 0 | 0 | 4 | 5 | 9 | 18 |
| Latin American Affairs CRT | 0 | 0 | 0 | 0 | 0 | 1 | 0 | 0 | 1 |
| Neuroscience BS | 0 | 0 | 0 | 0 | 3 | 6 | 9 | 7 | 25 |
| Political Science BA | 7 | 5 | 11 | 5 | 13 | 14 | 11 | 13 | 79 |
| Psychology AA | 0 | 0 | 0 | 0 | 0 | 0 | 0 | 0 | 0 |
| Psychology BA | 41 | 40 | 28 | 30 | 34 | 24 | 23 | 24 | 244 |
| Psychology BS | 20 | 36 | 56 | 48 | 51 | 51 | 61 | 57 | 380 |
| Public Sector Management PBC | 0 | 0 | 0 | 0 | 0 | 0 | 1 | 0 | 1 |
| Social Sciences BA | 0 | 0 | 0 | 0 | 0 | 0 | 0 | 1 | 1 |
| Sociology BA | 6 | 7 | 10 | 4 | 4 | 10 | 3 | 4 | 48 |
| Sociology BS | 0 | 0 | 1 | 3 | 9 | 10 | 6 | 5 | 34 |
| Modern World History GR CRT | 0 | 0 | 0 | 0 | 0 | 0 | 0 | 1 | 1 |
| SUB-TOTAL | 134 | 165 | 186 | 167 | 190 | 188 | 203 | 166 | 1,399 |
| GRAND TOTAL | 1,207 | 1,190 | 1,146 | 1,067 | 1,050 | 1,038 | 1,021 | 984 | 8,703 |