40 Change
We mentioned trends being a result of analyzing mathematical models, in other words we are looking at the change in behavior. In some cases this means change in population growth or a bank account balance, other times this could be the percentage of a drug present in the body. In order to illustrate this change we create a dynamical system model given by the following formula [9].
![]()
Here we are looking to find the difference in the present value ![]() and the previous value
and the previous value ![]() . Consider the following problem where we are asked to create a model from the given information.
. Consider the following problem where we are asked to create a model from the given information.
Example:
You currently have ![]() in a savings account that pays
in a savings account that pays ![]() interest each month. You add another
interest each month. You add another ![]() each month. Formulate a dynamical system that models change exactly for the described situation [9].
each month. Formulate a dynamical system that models change exactly for the described situation [9].
Let the initial amount be denoted as ![]() and we can denote our interest rate as it effects our saving account balance,
and we can denote our interest rate as it effects our saving account balance, ![]() , as
, as ![]() . Then we can format the change in the account balance as the following
. Then we can format the change in the account balance as the following
![]()
Since we were given the formula for a dynamical system to be
![]()
If we add ![]() to both sides we get
to both sides we get
![]()
And utilizing our known values we produce the following dynamical system.
![]()
Here we see that forming a dynamical system can be quite easy if we are given and initial value and rate of change. By creating a model for the example situation we would be able to predict the balance in the account in ![]() months, given that the current situation stays the same and the growth rate or deposit value doesn’t change.
months, given that the current situation stays the same and the growth rate or deposit value doesn’t change.
Now the rate of change comes in two forms, discrete and continuous. In our previous example we say a discrete rate of change where our increment of time was monthly. Examples of continuous change are heart rates, concentration of a drug in a body, the temperature of fresh coffee left to sit. Now, although these changes are continuous the dynamical system models we develop for these kinds of scenarios utilize discrete time intervals.
In the following example we look at a continuous rate of change model utilizing discrete intervals.
Example:
A certain drug is effective in treating a disease if the concentration remains above ![]() . The initial concentration is
. The initial concentration is ![]() . It is known from laboratory experiments that the drug decays at the rate of
. It is known from laboratory experiments that the drug decays at the rate of ![]() of the amount present each hour. Formulate a model representing the concentration at each hour and determine when the concentration reaches
of the amount present each hour. Formulate a model representing the concentration at each hour and determine when the concentration reaches ![]() .
.
We know that this is continuous because scientifically it is impossible for the concentration of a drug to stay constant and then every hour drops ![]() thus we should note that we may find that the concentration reaches
thus we should note that we may find that the concentration reaches ![]() between two hour marks. Firstly, we need a model to illustrate the scenario. We know that
between two hour marks. Firstly, we need a model to illustrate the scenario. We know that ![]() and that our concentration decays by
and that our concentration decays by ![]() of the previous value. Thus we have the following model. [9]
of the previous value. Thus we have the following model. [9]
![]()
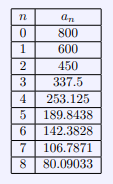
The following table gives us the calculated concentration rounded to the 5th decimal, per hour, for the first 8 hours.

Here we can see that at some time between hour 7 and hour 8 the concentration of the drug was exactly ![]() . For math modeling, an approximation like this can suffice in most cases.
. For math modeling, an approximation like this can suffice in most cases.
From this last example we were able to use the model we constructed to create a table for the behavior of a drug concentration. With this ability we could predict when the concentration of the drug becomes ineffective. Just through this example we can see how modeling can be vital to the medical industry in treating diseases if we can model a drugs effectiveness over time to best create a regimen for a patient. In the next section we will address interrelated models and how we can utilize our knowledge of the relationship to procure vital information to predict future trends.
