1 Learning analytics dice: instructions
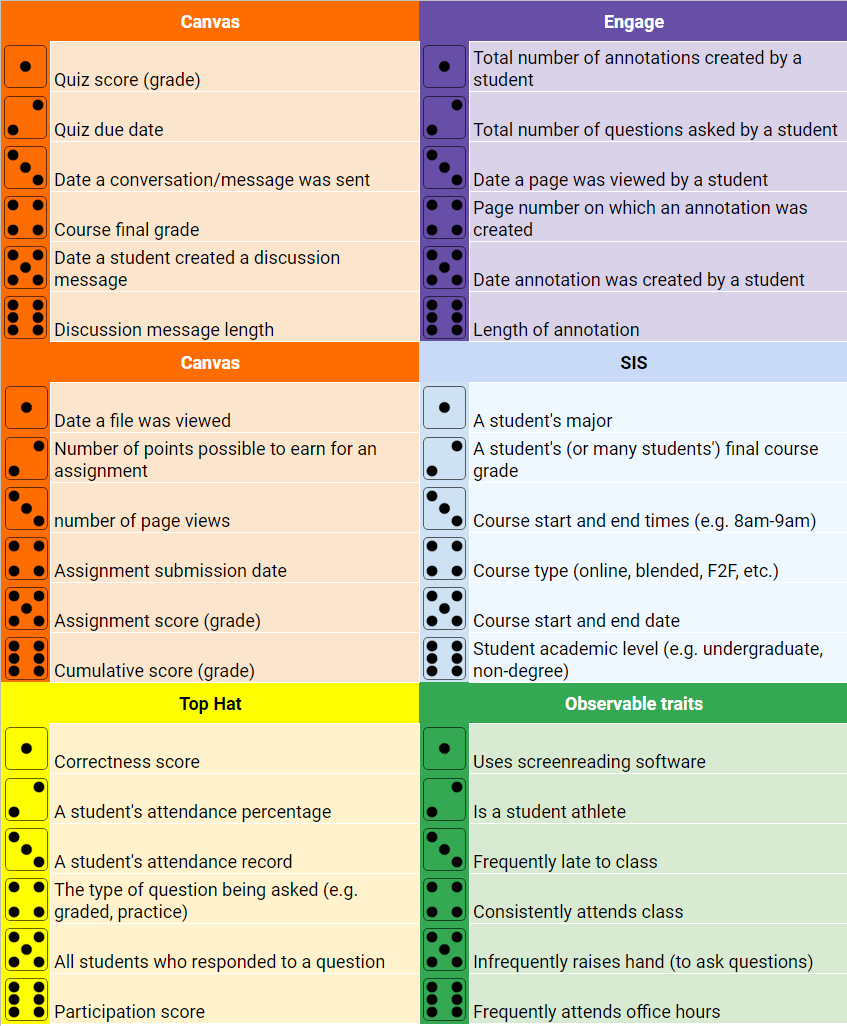
At this station, you’ll be brainstorming learning analytics research ideas using dice. The dice represent different services from which Unizin receives information; you will think about ways that we can use that information to learn more about how we teach and how our students learn.
How it works
- You have five dice, each representing a different service: Canvas, Top Hat, Engage, and SIS. Roll the dice and place your die on the grid in the corresponding space for each of the services.
- Using this information, create a profile of a student. (Assign values to each of the data points.)
- Using all or selected data points, work through the following questions:
- What questions can you answer about this student’s learning?
- What questions can you answer about the course instructor?
- What does this make you wonder that you can’t answer with these datapoints?
4. What can we discover about this student? (Submit your ideas in the form below.)
The following dice grid is provided:

Caveats and playing by your own rules
Having trouble coming up with a student profile? Reroll one or more dice. Feeling uninspired by your research idea or the student profile you generated? Reroll one or more dice. This is meant to be a generative activity, so make it work for you.
Not sure what one of your data points means? Ask! We’re all in this together! 😉
Submit your idea(s)
At any point in the dice throwing/brainstorming process you come up with a research idea that you’re excited about, submit it below. You can submit as many times as you would like.

