
Part Four: Sustainability and the Earth’s Future
Lab 11 Reading: Climate Change
Part A: The Role of the Sun
In this lab, you will examine the history of some natural variations in the energy emitted by the Sun and compare them with temperature changes on Earth.
Learning Objectives
- Examine historical measurements of temperature and graph temperature anomalies
- Analyze and interpret data related to the sunspot cycle and total solar irradiance
- Compare solar activity and atmospheric composition to the global temperature record
Our Sun: The Ultimate Source of Energy for Earth
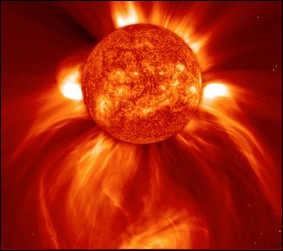
Figure 1.1. This image, taken 8 January 2002, shows a widely spreading eruption of plasma from the Sun, blasting out into space.
All of the energy that we detect as light and heat and other types of radiation originates from nuclear reactions deep inside the Sun’s high-temperature “core.” This core extends about one quarter of the way from the center of Sun (T ~28 million °F) to its surface (T ~ 10,000 °F). The Sun is mostly made up of hydrogen and helium, plus ~0.1% other elements. The Sun is neither a solid nor a gas but is in a state called plasma. This plasma is tenuous and gaseous near the surface, but becomes denser down towards the Sun’s fusion core. (See http://sohowww.nascom.nasa.gov/classroom/classroom.html for more details.)
Measuring Earth’s Temperature
Thermometers similar to modern mercury instruments were invented in the 1600s, and people began to measure air temperatures almost immediately. The longest continuous record of average monthly temperatures extends from 1659 to the present for an area in central England.
A few other places hold intermittent records almost as old, but more widespread and regular temperature measurements did not become common until the 1880s. A temperature record spanning 100-300 years may seem like a large data set, although it is only a small fraction of Earth’s history. The instrumental record is, however, long enough to reveal a trend, which has been called by various names: climate change, global warming, climate chaos, or “global weirding.”
Climate trends may be summarized using average global temperatures, but determining an average surface temperature for the Earth as a whole is a nontrivial process. Thermometers are not distributed evenly across the land surface, and even fewer measurements exist across the oceans.
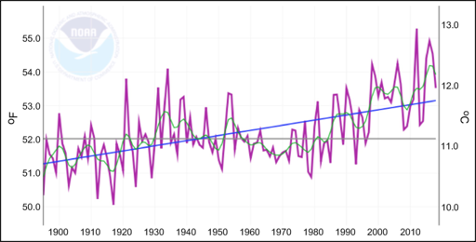
Figure 1.2. Temperature measurements and trends for the lower 48 states of the US. https://www.ncdc.noaa.gov/cag/national/time-series
Figure 1.2 illustrates average annual temperatures and trends for the continental United States (excluding Alaska and Hawaii), as calculated from historical temperature measurements. The purple line shows yearly averages for 1895-2018, and the green line plots 5-year averages, which smooths out some of the variability. The horizontal gray line is the average value for the entire twentieth century (1901-2000). Finally, the blue line is the best-fit trendline, which reveals that overall average temperatures for the lower 48 states have increased ~1 °C (1.8 °F) over the past 100+ years.
What is a Temperature Anomaly?
Scientists usually express regional or global average temperatures as anomalies, which are deviations from a chosen reference value. Whenever you see data plotted in terms of anomalies, always check the reference value. In climate studies, the reference value is often the
20th-century average (i.e., the gray line in Fig. 1.2), but the reference period may be 1951-1980 or some other interval, and the specific choice affects how a graph looks.
Like magnetic anomalies, temperature anomalies may be either positive (warmer than average) or negative (cooler than average). On Fig. 1.2, the vertical difference between the gray line (= reference value) and an annual average (a point on the purple line) represents the anomaly.
What causes temperature anomalies? Part of the answer is natural changeability: temperature varies from year to year, and on almost every day, the actual temperature differs from the average value for that day. In this exercise, however, and in all discussions about global warming, it is important to distinguish between weather (daily and seasonal changes) and climate (average weather over decades or centuries). Look again at the blue line on Fig. 1.2, which is rising through time. Can we explain the observed warming trend by natural variability alone? This question is addressed here.
Earth’s Temperature and the Sun
Changes in solar activity affect the amount of radiation that reaches the Earth, and thus they can affect temperature and climate. One type of solar variation comes from sunspots.
These are exactly what their name implies: darker areas that appear and disappear on the surface of the Sun. They are caused by temporary bursts of intense magnetic activity, which lower the temperature of the Sun’s surface. The number of sunspots varies from year to year, increasing and decreasing in a regular pattern. Astronomers have been recording their observations of sunspots systematically starting back in the year 1750. Total solar irradiation (insolation) increases when sunspots are numerous and frequent, i.e., when solar activity is high. In contrast, when sunspots are few, total solar irradiation decreases. Although the changes are small, they can affect Earth’s energy budget.
Part B: The Role of Carbon Dioxide
In this exercise, you briefly examine the history of climate science, analyze data for greenhouse gases (carbon dioxide and methane), and assess the possible causes of observed warming.
Learning Objectives
- Calculate rates of change for carbon dioxide through time
- Compare the patterns of carbon dioxide increase, solar activity, insolation, and the global temperature record
- Determine which variable best accounts for the observed increase in mean annual global temperature
Earth’s Atmosphere
Clearly, many different factors affect climate. The geological record reveals many variations in climate, from world-spanning glaciers (“Snowball Earth”) to ice-free polar regions (“Hothouse Earth”), but the current trends are different from past ones. Scientists have concluded that solar activity alone cannot explain recent global temperature changes. Stable isotopes of oxygen from deep-sea sediments and of hydrogen from ice cores have been used as proxies for temperature to determine that Milankovitch cycles caused glacials and interglacials during the Pleistocene Epoch. Both solar activity and orbital changes affect insolation, but the atmosphere of the Earth also plays a role in climate, and changes in atmospheric composition can affect temperatures at the surface.
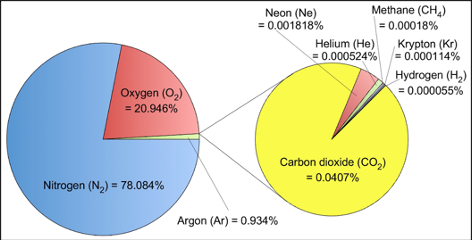
Figure 2.1. Major and trace gases in the atmosphere.
A Timeline of Climate Science
“A very large number of different theories of climatic change has been proposed. As more evidence about past climatic change is obtained, each theory has to meet continually more rigorous tests in order to explain the known facts. Each of the major theories of climatic change predicts a different temperature trend during the remainder of this century. A comparison of these predictions with the actual record at the end of the century [2100] will provide an important text of these theories.”
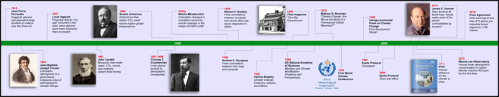
Figure 2.2. An abbreviated timeline of climate studies. See the PDF that accompanies this activity for a larger version of this figure.
The theories mentioned above include variability of the Sun, changes in the average elevation of the continents, the effects of volcanic dust, and increasing carbon dioxide concentration. Climate studies and the development of these theories began much earlier than many people think (Fig. 2.2); in other words, climate change is not a new or unexpected problem.
Adapted from https://www.americanscientist.org (vol. 98, no. 1, pg. 58-67)
Carbon Dioxide and Other Trace Gases
The air consists mainly of the gases nitrogen (N2, 78%) and oxygen (O2, 21%), and the other 1% is mostly argon (Fig. 2.1). The remaining 0.04% of the atmosphere comprises many trace components, including carbon dioxide (CO2). Carbon dioxide makes up only a tiny fraction of the atmosphere, so it is measured in parts per million (ppm). For comparison, 1% = 1/100 = 10,000/1,000,000 = 10,000 ppm. However, CO2 is important because it is a powerful greenhouse gas, which means that it functions like the glass of a greenhouse. Short- wavelength radiation from the Sun easily penetrates the atmosphere to warm the ground, but long-wavelength heat energy radiated from the Earth back toward space is absorbed by molecules of CO2 in the atmosphere. Other gases, such as methane (CH4) and water vapor (H2O), also trap heat, but climatologists estimate that about half of the observed warming has been caused by CO2.
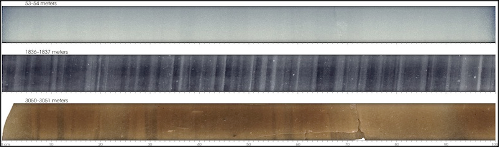
Figure 2.2. These sections come from different parts of an ice core. The top section was collected from 53-54 m below the surface, and its annual layers are faint. The middle section was collected from 1836-1837 m below the surface, where the weight of overlying ice had compacted the annual layers into easily distinguished stripes. The bottom section was collected from 3050-3051 m below the surface, where silt, sand and rocks are mixed with the ice and annual layers are hard to see. https://earthobservatory.nasa.gov/Features/Paleoclimatology_IceCores
The carbon dioxide concentration in the atmosphere varies with time due to various natural and anthropogenic processes. Air bubbles trapped in glaciers preserve samples of the atmosphere as it existed when the ice formed, and scientists can measure the CO2 concentrations in these bubbles. Simultaneously, the annual layers of ice (Fig. 2.2, where a pair of light and dark layers represents one year) indicate the age of the bubbles. Thus, it is possible to observe how the amounts of CO2 and other greenhouse gases in the atmosphere have changed through time.
Measuring Current CO2
Scientists measure atmospheric carbon dioxide at the Mauna Loa Observatory (MLO) on the Big Island of Hawaii. Due to its remote location in the Pacific Ocean, its high elevation (3397 meters, or 11,135 feet above sea level), and its great distance from major pollution sources, the MLO is a prime spot for collecting well-mixed samples of the planet’s air.
The MLO began continuously monitoring and collecting data related to climate change, atmospheric composition, and air quality in the 1950s. Today, the observatory is best known for documenting the changing CO2 concentrations in the atmosphere. Other research programs measure aerosols (particles or droplets in the air), solar radiation, ozone, and chemicals that destroy ozone (such as chlorofluorocarbons (CFCs) and hydrochlorofluorocarbons (HCFCs)).
Information from the MLO is also used to calibrate and verify data from satellites and from stations around the world and helps to quantify changes in the global carbon cycle.
Part C: Global Warming Effects
In this lab, you view several sequences of images from NASA that illustrate climate changes leading up to the present and projecting into the future.
Learning Objectives
- Analyze maps of Arctic sea ice extent and regional sea level rise
- Summarize variations in carbon dioxide concentrations and global temperatures
- Synthesize and interpret the data from this activity in a short essay
The Climate Is Changing
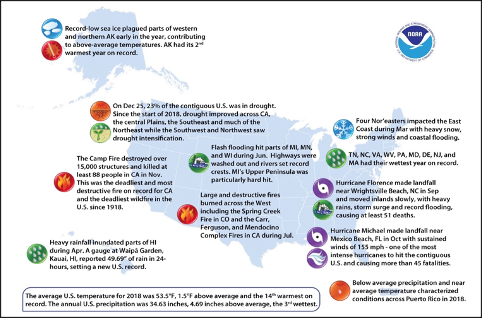
Figure 3.1. Significant weather and climate events in the United States in 2018. https://www.ncei.noaa.gov/sites/default/files/Annual-2018-US-Significant-Climate-Events- Map.png
Many people think of climate change as something that might cause problems, in the distant future or some place far away. However, as the image below shows, we are already experiencing some of the predicted results of increased temperatures. The National Oceanic and Atmospheric Administration produced this summary map for the US, and they post similar ones for the entire globe at the NOAA website <http://www.ncdc.noaa.gov/sotc/>.
The Global Change Research Program and the Earth Observing System
In the early 1980s, the National Space and Aeronautics Association (NASA) began working on an expansive Earth science program plan called Global Habitability, and this program eventually became the Mission to Planet Earth. NASA’s role in the U.S. Global Change Research Program has been to provide global data from space.
Fast-forward to 2007, and NASA had 17 space missions collecting climate data, although the Earth Observing System remains the agency’s primary contribution to American climate science.
Instruments on NASA’s Terra and Aqua satellites have provided the first global measurements of aerosols in our atmosphere, which come from natural sources such as volcanoes and dust storms, and man-made sources such as the burning of fossil fuels. Other instruments on board the Aura satellite study the processes that regulate the abundance of ozone in the atmosphere.
Data from the GRACE mission show unexpectedly rapid changes in the Earth’s great ice sheets. The OSTM/Jason-2 and Jason-1 missions are recording sea level rise at an increasing rate. All of these satellites and missions have collected a vast number of images and measurements. In this activity, you will look at a subset of images that illustrate changes that are already happening on Earth.
Decades of satellite-based solar and atmospheric temperature data helped the Intergovernmental Panel on Climate Change come to the conclusion in 2014 that “[h]uman influence on the climate system is clear, and recent anthropogenic emissions of greenhouse gases are the highest in history. Recent climate changes have had widespread impacts on human and natural systems.”
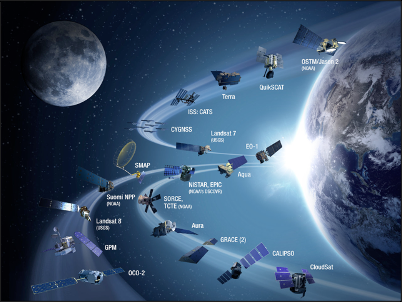
Figure 3.2 Paths of NASA satellites. https://climate.nasa.gov/nasa_science/history/
But there is still much to learn about what the consequences will be. How much warmer will it get? How will sea level rise progress? What will happen to soil moisture, and therefore agricultural production, in a warmer world? NASA scientists and engineers will help answer these and other critical questions in the future.
The NASA Climate Time Machine
This website contains a collection of images helps you to visualize how some of the crucial factors in Earth’s climate have been changing in recent years. The Time Machine is part of a joint project between educators and agency scientists to use NASA resources but allow you to study the issues independently and propose solutions based on objective information. The selected NASA images are organized into four modules. Each one illustrates an aspect of climate on a map of the world:
- Arctic sea ice
- Effect of rising sea level on coastal regions
- Carbon Emissions
- Average global temperature
Each map has a slider that you can use to move forward and backward in time, while you watch the changes occur. Open the Time Machine at <https://climate.nasa.gov/interactives/climate- time-machine/> and move through all of the menu options.
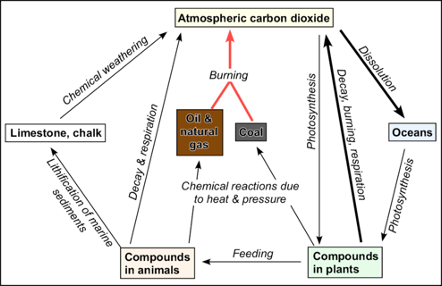
Figure 3.3. The carbon cycle: heavy arrows represent paths enhanced by human activity.

Feedback/Errata