
Part One: Fundamentals of Environmental Geology
Lab One Reading: Science, Observation, and Measurement
Science, Observation, and Measurement Reading
OBJECTIVES AND ACTIVITIES
- Learn how to make observations and measurements and perform a simple scientific study. Understand why science is contingent knowledge.
Activity 1.1: Observations and Measurements - Understand how scientists account for natural variation and why scientific knowledge is probabilistic.
Activity 1.2: Finding Big Foot
INTRODUCTION
The way that a discipline creates knowledge is often referred to as an epistemological approach. It is the way in which knowledge is created. Different disciplines seek to know different ideas or phenomenon. Because each discipline seeks to know something different about the Universe, each discipline has developed its own way or method of study. For instance, the discipline of Culinary Arts wants to know how to create and prepare delicious foods and the discipline of Mathematics seeks to know the relationships between measurements, quantities, and sets using numbers and symbols. The Culinary Arts means to develop knowledge about food through sensory development like tasting and smelling and practicing culinary techniques. You would not attempt to develop a new recipe by the same means that you would solve a Mathematical theorem. These two disciplines are very different in what they seek to know and how they work to know it.
The discipline of Science, like all disciplines, has a unique purpose of study and a unique means to study it. According to the article, “The Nature of Science and the Scientific Method” by Christine McLelland, Science is defined as:
“… a way of knowing that seeks to understand the physical universe and its natural phenomena through observation, measurement, and constant evaluation and reevaluation of logical interpretations.”
To better understand what Science is (and isn’t), we have to look more closely at this definition to see the limitations and assumptions of Science as a discipline. First, Science is “a way of knowing that seeks to understand the physical universe and its natural phenomena.” This means that Science is limited to only knowing the natural, physical universe. It cannot know and was not meant to understand those phenomenon or ideas that are not a part of the physical universe. This means that ghosts, feelings (like love), and the existence of God or gods are not ideas that can be known or understood through Science. This does not mean that ideas like ghost, love, and god are not valid ideas, it only means that Science is not the correct discipline by which to know these ideas.
Second, Science “seeks to understand … through observation, measurement, and constant evaluation and reevaluation of logical interpretations.” This means that scientists must accept a few assumptions about how it comes to know.
Assumption 1: The physical universe is real.
If you have read Descartes, you know that he was very interested in finding the first step(s) to knowledge. He wanted to know how to begin to understand. In his musings, he realized that he had to first realize that “thought exists.” If his thoughts existed, then he must exist. The idea of existence is the first step to knowledge. He then came up with his know famous line: cogito ergo sum. Translated from Latin into English it states: “I think, therefore I am”. He was also the founding philosopher of modern science, so our first assumption about scientific knowledge must be that the thing we want to study is real; therefore, we must all first agree to assume that the physical universe is real.
Assumption 2: Humans have the ability to accurately observe, measure, and understand the physical universe.
This assumptions means that we have to agree that humans are smart. And smart enough to observe natural phenomenon; smart enough to measure natural phenomenon; and smart enough to interpret what those observations and measurements mean.
This is what we will spend the majority of this class practicing: using observations and measurements to understand a specific phenomenon or to answer a question. Start by committing the two definitions to memory:
Observation – Perceiving through our senses (e.g., sight, hearing, feeling, smelling, or tasting) or through instrumentation (e.g., microscopes or telescopes) and noting the specific details of a physical phenomenon. Observations include color, texture, and qualitative amounts (e.g., few or many). Because observations are qualitative perceptions, they are not necessarily transferable between scientists or researchers. For instance, color is not always perceived the same way. What someone might call purple might be heliotrope to another person. For this reason, some observations cannot be compared across studies.
Measurement – The numerical quantity or standard associated with any observation. Measurements are often referred to as data. Measurements are therefore quantitative and can be compared across studies; they are transferable between scientists and researchers. Measurements can be made using simple standardized tools like rulers (length) or graduated cylinders (volume) and complex instruments like global positioning systems (GPS; elevation and distance) or ion chromatography (solute concentration).
Assumption 3: Observations of the physical universe are enough to explain natural processes.
This means that we don’t have to depend on other ideas to understand what we observe and measure in the physical universe. This is the assumption that limits science from knowing anything supernatural. For instance, science cannot know that the reason why a child survived a life threatening illness was due to love. Love is not a part of the physical universe. While love is a very powerful idea and very real to the human experience, it is not observable or measurable in a physical way. This means that science cannot know love.
Assumption 4: Scientific knowledge is contingent knowledge.
If you review any standard list showing the steps of the scientific method, there is a step that always discusses reviewing and modifying conclusions. All scientific studies must go through an external review process called peer‐review in order to be considered a scientific idea, hypothesis, or theory. This is why scientists are constantly going to conferences to present their work and attempting to publish their work in peer‐reviewed journals. This means that ideas are constantly being reviewed, modified, and studied. No idea is every “set in stone” because as more observations and measurements are made, scientists need to review their work in the context of the new data and make modifications to their conclusions. Even today, the idea of gravity (considered a Scientific Law) is reviewed and modified as scientists gather more information about how celestial bodies interact in outer space.
Assumption 5: Science is probabilistic; it is never absolute.
This assumption goes along with Assumption 4. While we won’t go too much into statistics in this class, we need to understand that there is natural variation in the physical universe. Not all humans are the same height, for instance. And it would be nearly impossible for someone to measure every person on the planet. Therefore, scientists must depend that the sample size they study is representative of the whole. For instance, in this lab we will look at human height. Do you think that measuring the 20 or so people in your lab class is representative of all the people in the world? Probably not. So part of the review process and contingent nature of scientific knowledge is due to the fact that scientists cannot feasibly measure all of everything they study. Unless they can measure all of everything they study, scientific conclusions will be probabilistic. This is why scientists use terms such as “likely” or “highly likely.” They are saying that their conclusions are likely or highly likely representative of the whole phenomenon.
PART 1A: MEASUREMENTS
As we just learned, measurements are transferable ideas between scientists. In order for measurements to be transferable across researchers, studies, and even languages, scientists agreed upon a standard means of measurement. This is the International System of Units (SI; Système International d’Unités) and it is based on the metric system.
Here in the United States of America, we are accustomed to inches, square feet, gallons, and pounds for length, area, volume, and weight/mass, respectively. But scientists measure in terms of meters, square meters, liters, and grams for length, area, volume, and weight/mass, respectively. This is called the metric system, a system of measurement based on the number ten (10) with a base unit for each type of measurement. See Table 1 for the base unit for each type of measurement. See Table 2 for the list of prefixes associated with each base. A prefix describes how many times you multiple the base unit.
| Type | Base Unit | Abbreviation
|
| length | meter | m |
| area | square meter | m2 |
| volume | liter | L |
| weight/mass | gram | g |
TABLE 1 Base units for the SI system of measurement. SI uses degrees K (Kelvin) for temperature, but we will use both Fahrenheit and Celsius in our lab.
PART 1B: ACCURACY AND PRECISION
Whenever we make measurements, it is important that we consider the accuracy and precision of those measurements. Accuracy is how close our measurement is to reality and precision is how reproducible our measurement is. In scientific studies, it is important that measurements be accurate (correct) and precise (reproducible).
What we use to measure and who we choose to make the measurement are important. You wouldn’t use a tape measure to determine the distance traveled in kilometers from Indianapolis to Chicago. And you wouldn’t ask a five year old to do it. That would likely result in a very poor measurement that was neither accurate nor reproducible. (And it would really wear out the kid.)
| Prefix | Base Unit | Abbreviation or Symbol |
| giga- | 1,000,000,000 | G |
| mega- | 1,000,000 | M |
| kilo- | 1,000 | k |
| hecto0 | 100 | H |
| deka- | 10 | da |
| deci- | 0.1 | d |
| centi- | 0.01 | c |
| milli- | 0.001 | m |
| micro- | 0.000001 | μ |
| nano- | 0.000000001 | n |
TABLE 2 Prefixes and their multipliers for the SI system of measurement. For instance, a kilometer is one thousand meters. A centimeter is one‐hundredth of a meter.
Instead, you would likely use an odometer, like the one in your car, or a GPS instrument. Both of those would be more accurate than a five year old with a tape measure. If you used a car, you might find that your distance is slightly different each time depending on what roads you took or where you started, so a car odometer might not be the most precise. However, a GPS which uses satellites and computers to measure the distance would likely be the most accurate and precise measurement.
PART 1C: DETECTION LIMIT
As we just learned, using the right tool can help us to make an accurate and precise measurement. Part of choosing the right tool means understanding what the detection limit of that tool is. A detection limit is the smallest or largest measurement a tool can make while still being accurate and precise.
For instance, the low detection limit of a ruler is likely one half of the smallest marked increment. In Figure 1 below, you can distinguish when something is between two marks or roughly half of the smallest increment.
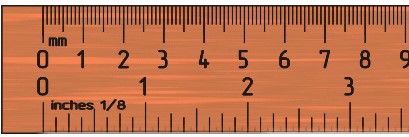
FIGURE 1 Part of a ruler.
* Read the fraction as “one foot per twelve inches” and the decimal as “one inch equals 0.083 feet.”
The high detection limit for a twelve inch ruler is likely around 10 feet as that is what most people can keep track of adding together. You would not want to use a twelve inch ruler to measure the height of the SL building on campus. A 30 foot tape measure would be better because the 30 foot tape measure would have the higher detection limit.
For many scientific tools, like graduated cylinders or volumetric flasks, the tools are created from a standard. For volumes, the standard is a graduated cylinder or volumetric flask from which others are created. These standards are numbered and maintained by the ASTM (American Society for Testing and Materials). Graduated cylinders and flasks used for scientific work are given a serial number to denote from which standard they were created. These graduated cylinders and flasks are very expensive!
We won’t be using ASTM certified graduated cylinders for our lab, but when you read the graduated cylinder, you should note what it says at the top of the cylinder: Depending on the size of the cylinder, it will tell you the accuracy as +/‐ a volume based on a temperature, usually, 20 or 25 C. (Water expands as it increases in temperature.) Depending on which standard was used and how far removed the tool is from the standard, the tool will have a different level of accuracy.
You want to make sure that you choose the correct sized tool of measurement for the amount you want to measure. You wouldn’t use a 250 mL graduated cylinder with an accuracy of +/‐ 5 mL to measure one drop of water. A 2 mL graduated cylinder with an accuracy of +/‐ 0.1 mL would be a better tool as it would have a lower low detection limit; it would be able to accurately measure a volume of a drop which is about 0.5 mL. Conversely, you wouldn’t use a 2 mL graduated cylinder to measure 150 mL as the 2 mL graduated cylinder would not have a high enough detection limit; it would not be able to accurately measure 150 mL of water. A 250 mL graduated cylinder would be a better tool as it has a higher high detection limit.
Because of detection limits, scientists – or good scientists – do not tend to report “zero” as a measurement. Instead, scientists will note that the measurement was “below detection limit” often abbreviated “< DL”, less than detection limit. This is often used in analytical work when scientists are trying to measure very small amounts.
PART 1D: SIGNIFICANT DIGITS
A significant digit is a number we can be certain of using to describe a measurement. In the discussion regarding detection limits, we saw that we could measure something to at least half of the smallest increment. This means that using the ruler in Figure 1, you could measure something that was 25.5 mm (2.55 cm) long. You have three significant digits as we can be certain that our measurement is accurate up to three numbers. You could not say that whatever you measured was 25.523451 mm long as there is no way for us to determine the accuracy of those other digits based on the measurement we made. Significant digits are very important when we start converting between systems of measurement.
PART 1E: CONVERSIONS
Because we use both English and metric systems to make measurements, it is important for us to know how to convert between the two systems. In this class, we will try to stay in the metric system, but sometimes it is difficult for students to imagine distances or sizes based only the metric system. So we will often describe measurements in both English and metric units. But this means that we need to be able to move between the two systems. We do this by converting the measurements from one system to another using conversion factors. See Table 3 for a list of common conversion factors.
Length ‐
|
Have |
Want |
Multiply by |
|
in |
ft |
1/12 or 0.083* |
|
ft |
in |
12 |
|
cm |
in |
1/2.54 or 0.394 |
|
in |
cm |
2.54 |
|
cm |
m |
1/100 or 0.01 |
|
m |
cm |
100 |
|
ft |
m |
1/3.28 or 0.305 |
|
m |
ft |
3.28 |
|
km |
mile |
1/1.61 or 0.621 |
|
mile |
km |
1.61 |
* Read the fraction as “one foot per twelve inches” and the decimal as “one inch equals 0.083 feet.”
Area ‐
|
Have |
Want |
Multiply by |
|
in2 |
ft2 |
1/144 or 0.00694* |
|
ft2 |
in2 |
144 |
|
cm2 |
in2 |
1/6.54 or 0.155 |
|
in2 |
cm2 |
6.54 |
|
cm2 |
m2 |
1/10,000 or 0.0001 |
|
m2 |
cm2 |
10,000 |
|
ft2 |
m2 |
1/10.8 or 0.0929 |
|
m2 |
ft2 |
10.8 |
|
km2 |
sq mile |
1/2.59 or 0.386 |
|
sq mile |
km2 |
2.59 |
|
acre |
hectare |
1/2.47 or 0.405 |
|
hectare |
acre |
2.47 |
*Read the fraction as “1 square foot per 144 square inches” and the decimal as “one square inch equals 0.00694 square feet.”
Volume ‐
|
Have |
Want |
Multiply by |
|
in3 |
ft3 |
1/1,728 or 0.000579* |
|
ft3 |
in3 |
1,728 |
|
cm3 or mL |
in3 |
1/16.4 or 0.0610 |
|
in3 |
cm3or mL |
16.4 |
|
cm3 or mL |
m3 |
1/1,000,000 or 0.000001 |
|
m3 |
cm3 or mL | 1,000,000 |
|
ft3 |
m3 |
1/35.3 or 0.0283 |
|
m3 |
ft3 |
35.3 |
|
L (liter) |
gallon |
1/3.79 or 0.264 |
|
gallon |
L (liter) |
3.79 |
Read the fraction as “1 cubic foot per 1,728 cubic inches” and the decimal as “one cubic inch equals 0.000579 cubic feet.”
TABLE 3 Commonly used conversion factors.
Let’s start with something simple. Table 3 tells us that one inch is equal to 2.54 centimeters. If you have something that is 12.7 inches long and you want to know how many centimeters it is, you would multiple 12.7 inches by 2.54 cm. We can train ourselves to make these conversions by practicing simple multiplication:
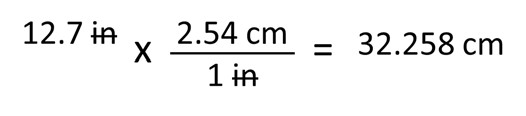
12.7 inches multiplied by 2.54 centimeters per one inch equals 32.258 centimeters. Notice first that our unit of inches cancel out to only leave a unit of centimeters. Now think about the significant digits. Because we only measured up to a tenth of an inch and have three significant digits with our original measurement, our converted measurement must also only have three significant digits. Our answer should be 32.3 cm, rounding up from 32.258 cm.
If we wanted to know what our measurement would be in meters, we would have to convert our centimeters to meters. To do this we would use the following:
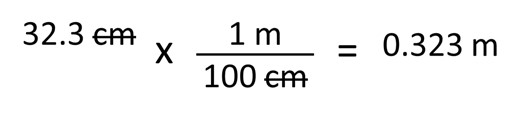
32.3 centimeters multiplied by one meter per 100 centimeters equals 0.323 meters. Notice that again our units cancel out and that we retain three significant digits.
PART 2A: SCIENTIFIC METHOD
The scientific method is the means by which scientists study the physical universe. While different disciplines of science (physics, chemistry, biology, and geology ‐ and even different textbooks within the same scientific discipline) will list different steps, the basics are this:
- (1) Observe–Observe natural phenomena, taking preliminary measurements.
- (2) Question–Ask a question about the observations, attempting to explain the phenomenon.
-
- (3) Develop a Hypothesis – Develop a simple answer to the question based on an “if‐then” statement. (The answer must be falsifiable.)
- (4) Design a Test – Design a study or experiment which tests the hypothesis.
- (5) Collect Data – Implement the test design and record observations and measurements.
- (6) Analyze and Conclude– Complete an analysis of your data.
- (7) Validate– Present your hypothesis, study design, data, and results to your peers for criticism.
- (8) Modify and Publish – Based on criticism, repeat study or modify interpretations.
- (9) Repeat– Continue to test the hypothesis.
For the sake of this class, we aren’t going to ask you to present your hypothesis and study at a conference or to repeat it to finish the class, but we should all discuss our results as a class to determine how confident we are with our conclusions.
PART 2B: DESIGN AN EXPERIMENT
The best scientific experiments are simple and elegant, requiring little manipulation but many observations and measurements. For instance, Dr. David Schindler is famous for directing whole lake experiments that demonstrated the effects of excess nutrients in lake ecosystems. In one famous experiment, he simply separated the flow between two halves of a lake, added nutrients to one side and none to the other and watched the effect. This very simple and elegant experiment was done in the 1970s but is still studied today. See Figure 2.Unfortunately, we don’t have a whole lake to play around with and such an experiment would take time to develop. But that doesn’t mean our simple experiments cannot be meaningful. What will make them meaningful is how we use what we have to design an experiment that can answer the question(s) we pose. When designing an experiment, we need to consider sample size, the number of subjects in our study and the number of observations and measurements we will make. For our study to be meaningful, we have to be certain that our sample size is representative of the whole. In Schindler’s lake experiment, he studied the entire lake ecosystem. He didn’t need to manipulate a sample of the lake, he used the entire lake. So, his results were representative of the entire lake. (But it might not have been representative of all the lakes in the entire world.)

FIGURE 2 Experimental Canadian Lake 226, a simple experiment showing the effects of added nutrients (e.g. nitrogen and phosphorus) to a lake ecosystem. This study was designed by Dr. David Schindler. The lower right shows a green water due to high amounts of algal growth; the upper darker water shows a natural, non‐ enriched lake ecosystems where algal growth is limited. Image Credit: David Schindler, 1974. Originally published in Science, Vol. 184, No 4139 (897 – 899).
A simple way to determine if your sample is representative of the whole is to compare the measurements of your sample to the normal distribution. In nature, natural variability tends to follow a pattern in which the number or frequencies of measurements create a symmetrical bell‐shaped curve when you graph the number of occurrences per measurement. See Table 4 and Figure 3.
Length (cm) Frequency (Occurrence) 1 3 2 14 3 56 4 92 5 136 6 84 7 60 9 12 10 1 TABLE 4 Data showing the frequency of occurrence for data that are normally distributed.
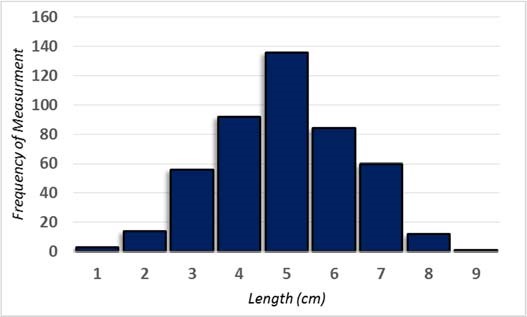
FIGURE 3 Graph (histogram) showing that the data in Table 1 are distributed in a bell‐shaped pattern, with the most number of measurements clustered around a mean value of 5. The dashed red line shows how this looks like a bell; hence, this distribution is also called a bell curve.
Scientists use this tendency of natural variation to follow the normal distribution as a means to determine if their sample is representative of the whole. If your sample follows a normal distribution, it is likely that your sample does represent the whole population.
However, if your sample does not show a normal distribution, it is likely that you need more subjects and/or measurements.
If your sample does follow the normal distribution, it means that your results and conclusions can be extrapolated to a larger population. If not, it means that your results and conclusions cannot – or can but with limitations on the interpretations. In general, studies are more powerful (have more meaning) when they have more subjects, observations, and measurements. This is because even if your sample does follow a normal distribution, it is not known if your mean (average or center point of your distribution) is the same as the whole population’s mean. And, to complicate matters, some natural variation does not follow a normal distribution – but we’ll leave that for a Statistics course to tackle.

Feedback/Errata