
9 Acid-Base Titration Curves
Yu Kay Law
Purpose
To compare and contrast acid-base titration curves for different acid-base titrations.
Learning Outcomes
- Identify the features of different types of acid-base titration curves.
- Determine the concentration of analyte present, as well as the acid ionization constant
 and base ionization constant
  .
. - Select appropriate indicators for use in a titration.
Textbook Reference
Tro, Chemistry: Structure and Properties, Ch. 17.4
The write-up below covers merely the very basics of what the lab entails; more details are covered in your textbook which you are expected to refer to.
Introduction
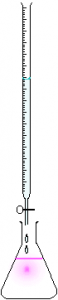
of the setup for
a titration.
Acid-base titrations involve the dropwise addition of one solution-phase reagent (using a buret) into a carefully measured amount of another reagent (in an Erlenmeyer flask). There are three main classes of titrations that can be studied:
- Strong acid-strong base
- Weak acid-strong base
- Weak base-strong acid
In this experiment, you will examine the titration curves for each of these types of titrations. In each case, we are studying an acid-base neutralization reaction.
Equivalence Points
One particularly important point in a titration curve is the equivalence point. The equivalence point is the point in the acid-base titration at which each molecule of HA is neutralized by one OH– ion, causing the acid to be converted to its conjugate base. Or, if a base is the analyte, the point where each molecule of the base A– is neutralized by one H3O+ ion, causing the base to be converted to its conjugate acid.
Types of Titration Curves and its Features
Strong Acid-Strong Base Titrations
When titrating a strong acid, such as hydrochloric acid with sodium hydroxide, you are reacting the HCl directly with NaOH
(1) 
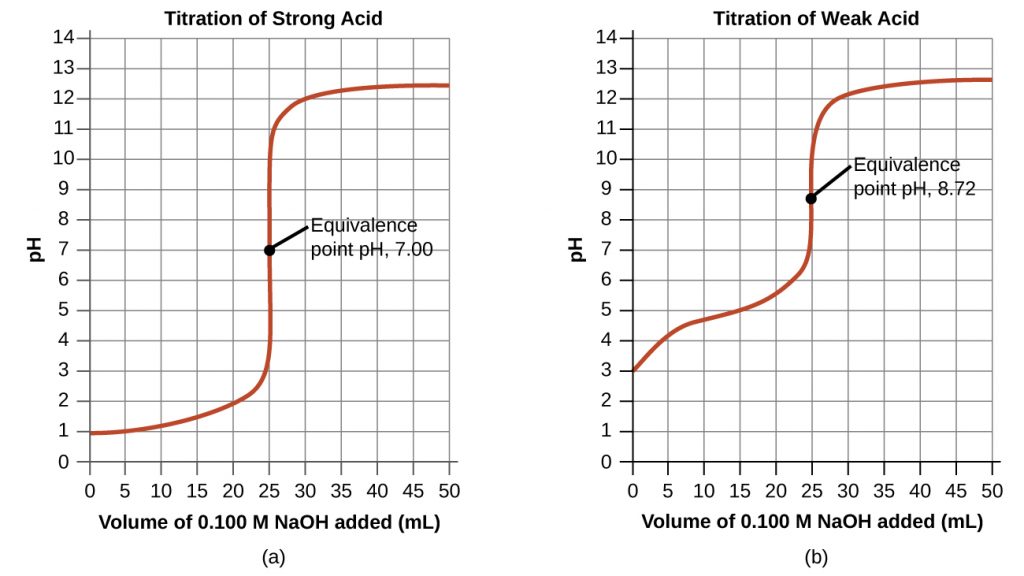
The titration curve is shown below. In this case, there is a very sharp transition in pH at the equivalence point. Furthermore, as the salt formed in the neutralization reaction is neutral, the solution at the equivalence point is neutral.
Weak Acid-Strong Base Titrations
An example of such a titration would be acetic acid (CH3COOH) with sodium hydroxide. In this case, the reaction is
(2) 
or, for the net ionic equation,
(3) 
In this case, there is one important aspect to note. As the neutralization takes place, there will be appreciable amounts of both CH3COOH, a weak acid, and CH3COO–, its conjugate base, present in the solution. This mixture is a buffer solution. As a result, a gradual transition in the pH is observed in this solution as shown in the figure above, as opposed to the very sharp transition observed for strong acid-strong base solutions.
At the equivalence point, all of the CH3COOH is converted to CH3COO– , a weak base. Therefore, the solution is basic at the equivalence point.
Beyond this point, as additional OH– is added, a sharp transition in the pH curve is observed.
Importance of the Half-Equivalence Point: Finding
To identify the half-equivalence point of a solution, you start by identifying the equivalence point of the titration curve and then halving the volume. Then, you find the point on the curve where this volume of the titrant was added.
Example
Consider the weak acid-strong base titration curve shown above. The equivalence point is at 25 mL and hence the volume of NaOH added at the half-equivalence point is  . At this point, the pH is 4.9.
As mentioned before, in this region the mixture behaves as a buffer solution, where we can use the Henderson-Hasselbalch equation
(4) ![\begin{equation*} \mbox{pH} = \mbox{p}K_a + \log_{10} \left(\frac{[\ce{A-}]}{[\ce{HA}]}\right) \end{equation*}](https://iu.pressbooks.pub/app/uploads/quicklatex/quicklatex.com-1da79b5e0c39a77cd5f8e976a0d113f9_l3.png "Rendered by QuickLaTeX.com")
At the half-equivalence point, as ![[\ce{A-}]=[\ce{HA}]](https://iu.pressbooks.pub/app/uploads/quicklatex/quicklatex.com-eed1372b6ffcf4a0473aba2739000017_l3.png "Rendered by QuickLaTeX.com") ,
,
(5) 
from which you can find .
Example
From above, we saw that the pKa of the analyte in the weak acid-strong base titration curve above is 4.9. Therefore,
(6) 
Weak Base-Strong Acid Titration Curves
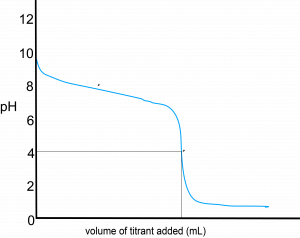
This type of titration would yield a curve with decreasing pH, given that you’re neutralizing base with a strong acid:
(7) 
where HA is the conjugate acid of the original weak base A– and is therefore a weak base. A few features can be found … the flip side of the weak acid-strong base titration curve:
- At the equivalence point, we have a solution of HA, the weak acid. As a result, you would have an acidic solution (pH < 7) at the equivalence point.
- Before you hit the equivalence point, you would have a mixture of HA and A–. Similarly, you would have a buffer solution in that region, leading to the gradual decrease in pH there.
Similarly, therefore, we can use the half-equivalence point to find the Kb of the weak base. In this case, the pH is the pKa of the conjugate acid of the weak base.
Example
Examining the curve above, the pH at the half-equivalence point (as defined for weak acid-strong base titration curves) is approximately 7.5. Given this,  for the conjugate acid. Therefore, we can relate this to the of the weak base as follows:

Experimental Procedure
- Before doing this experiment, please review the section on Using ChemCollective Virtual Labs.
- For your lab notebook, you must:
- Record, in handwriting on your regular lab notebook, your purpose, procedure, and results similar to a face to face experiment.
- Include a set of screenshots as directed below.
- If you think that a change to the procedure would help, then feel free to do so. Just make sure it is documented in your lab notebook. Feel free to consult with your lab instructor if you’re unsure, but remember there are no safety implications.
- A separate report form will be provided in MS Word format.
Strong Acid-Strong Base Titration
You will use the ChemCollective Strong Acid and Base Problems virtual lab to perform this virtual titration. For further details on how to do this on the electronic platform, please see: Using ChemCollective Virtual Labs.
- Obtain a buret (from Glassware > Other) and the 0.1 M sodium hydroxide.
- Fill the buret with the 0.1 M sodium hydroxide to about the 10.00mL mark. Read and record the volume reading on the buret, paying attention to the (a) direction that the numbers are graduated and (b) the number of significant figures.Data
- Obtain a 0.1 M hydrochloric acid solution, a 10 mL volumetric pipet, and a 250 mL Erlenmeyer flask.
- Withdraw 10.00 mL of the hydrochloric acid solution into the pipet. When this is done, obtain a screenshot of the interface.
- Move the pipet away from the flask of 0.1 M hydrochloric acid solution and put it on top of the empty 250 mL Erlenmeyer flask. Dispense the hydrochloric acid from the pipet into the Erlenmeyer flask.
- Select the Erlenmeyer flask and record the pH of the solution.
- Put the buret on top of the Erlenmeyer flask, and dispense approximately 0.5 mL of the sodium hydroxide solution into the Erlenmeyer flask. Record the volume in the buret. Record the pH of the solution in the Erlenmeyer flask.
- Repeat step 7 until the pH remains relatively constant.
A video demonstration of how to do this experiment (somewhat badly) is shown below:
Data Analysis
To plot the titration curve, first find the total volume of NaOH added at each step of the titration above. Then, plot the pH as a function of the volume of sodium hydroxide added. It’s not critical how the curve is fitted; however, it is important that you have a rather dense set of gridlines. How this can be done with Excel is demonstrated below:
Weak Acid-Strong Base Titration
You will perform an unknown weak acid-strong base titration using the ChemCollective Unknown Acid and Base Problem simulation.
Complete the experiment following the same procedure as for the strong acid-strong base titration, except you need to use the unknown acid instead of hydrochloric acid.
Take a screenshot of your titration setup at some point during the titration procedure (i.e. with the buret above the Erlenmeyer flask).
Make a plot of the acid-base titration curve as above.
Finding the Molarity of the Unknown Solution
To find the molarity of the unknown solution, remember that at the equivalence point the number of moles of acid initially present equals the number of moles of base added for a monoprotic acid. Therefore, you can perform a stoichiometry problem by using the definition of molarity, similar to what is described in Tro, Chemistry – Structures and Properties, 2nd Ed, Ch. 8.7. An example of how this is done is explained in the following video:
https://iu.mediaspace.kaltura.com/id/1_7pl9o19p?width=400&height=285&playerId=26683571
pH at the Equivalence Point
Remember that at the equivalence point, all of the acid would have converted to its conjugate base. We therefore have a solution of the conjugate base of the weak acid. This is therefore a weak base problem.
- Find the concentration of the weak base solution at the equivalence point by performing a dilution problem using
 , where
- M1 is the molarity of the original unknown solution, found as described above.
- V1 is the volume of the unknown solution in the Erlenmeyer flask (analyte).
- M2 is the molarity of the diluted solution
- V2 is the volume of the mixture in the Erlenmeyer flask including all components, which we will approximate to be the sum of the volumes of acid and base added.
- Given the value of Ka, find the value of Kb using the formula
 .
. - This then becomes a weak base pH calculation similar to that calculated in the regular course. As a refresher, the following video outlines how to solve this type of problem:
https://iu.mediaspace.kaltura.com/id/1_ldt19iip?width=400&height=285&playerId=26683571
Weak Base-Strong Acid Titration
Using the ChemCollective Unknown Acid and Base Problem simulation that you used for the previous part, repeat the procedure but use the unknown base as the analyte and the 0.1 M HCl as the titrant instead. Similar approaches to find the pH at the equivalence point to the above can be found, except that this would now be an acidic salt.