
6 Properties of Gases
Purpose
To investigate simple gas laws and explain them in terms of kinetic molecular theory.
Learning Outcomes
- Use a molecular-level simulation to investigate and interpret phenomena.
- Report measurements with associated error estimates.
- Graphically relate the data and compare with what you expect from the ideal gas law, including the use of error bars.
Textbook Reference
- Tro, Chemistry – A Molecular Approach, 5th Ed, Ch. 6.2-6.4 and 6.8.
Introduction
In this experiment, we will explore some of the gas laws that empirically describe the behavior of ideal gases and attempt to explain these using the kinetic molecular theory of gases.
Gas Laws
While gas molecules vary in their molecular geometry and polarity, many gases behave in a similar manner. The macroscopic behavior of most common gases at room temperature can be described to a very good approximation by the simple gas laws:
- Boyle’s Law: The pressure (
 ) of a particular gas sample is inversely proportional to its volume (
 ), given constant temperature, i.e.
(1)

or
(2)

- Charles’ Law: Under constant pressure, the volume () of a given gas sample is proportional to the temperature (
 )
)
(3)

or
(4)

- Avogadro’s Law: Under constant pressure and temperature, the volume () of a gas sample is proportional to the number of moles of gas (
 ).
).
(5)

A gas that obeys these gas laws is defined as an ideal gas. While no gas obeys the ideal gas law exactly, most gases at room temperature and pressure do follow the ideal gas law to a large extent.
When put together, the overall set of properties of an ideal gas can be summarized by the ideal gas law:
(6) 
where the pressure is reported in atmospheres, the volume is in liters, is the number of moles of gas, is in Kelvins, and the ideal gas constant  .[1]
.[1]
In this experiment, we will study the extent to which Boyle’s Law and Charles’ Law can describe the behavior of a gas and attempt to use this to determine the number of moles of gas present.
Kinetic Molecular Theory of Gases
It has been postulated based on the particulate nature of matter that an ideal gas can be described using the kinetic molecular theory. Here are the postulates of this theory:[2] In this model, a gas is modeled as a collection of particles in constant motion, which move in a straight line until a collision occurs.[3]
- The size of the particles are negligibly small; the volume of the container is mostly empty space.
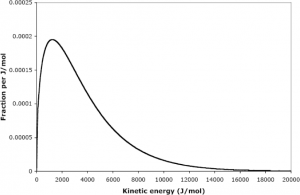
- The average kinetic energy of the particles is proportional to the temperature in Kelvins.
- Collisions between particles and between the particle and the walls are completely elastic; there is no loss of kinetic energy.
It is important to recognize here that it is the average kinetic energy, not velocity (recalling from physics that the kinetic energy is  ), that is proportional to the temperature. Furthermore, the energies of different particles form a distinct distribution as illustrated below:
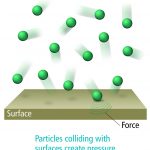
In this model, we recognize that gas pressure arises due to the force associated with the collision between particles of a gas and its container. Furthermore, we can show that, using classical physics, we can use the kinetic molecular theory of gases to back-derive the ideal gas law.[4]
In this experiment, we will not attempt to quantitatively derive the gas laws from kinetic molecular theory; rather, we will try and visualize what happens at the particulate level and apply the kinetic theory of gases and develop explanations this way.
Relationship Between Pressure and Volume
Experimental Procedure
In this experiment, you will use the PhET Gas Properties simulation to examine Boyle’s Law, and attempt to visualize how this can be explained using the kinetic molecular theory of gases.
- Open the simulation and select the ideal tab.
- Pump in a sample of gas. It will enter a rectangular chamber. Select Temperature (T) under “Hold Constant”.
- Select “Width”. It will give you a measurement of the width of the chamber (and hence the volume of the chamber).
- Wait until the pressure remains reasonably constant. Record the width of the chamber. In addition, estimate the average pressure and how much the pressure fluctuates. For example, if the pressure fluctuates between 5.5 atm and 6.3 atm, a reasonable estimate might be (5.9 ± 0.4) atm. This means that the best estimate is 5.9 atm, but the error in the measurement is 0.4 atm.
- Qualitatively observe how fast the particles are moving in the box.
- Measure the number of collisions of the particles with the wall per unit time by selecting the collision counter and then hitting “play”. (Be sure to wait until the count stops increasing before recording). Measure and record this five times; there will be different measurements each time. Record the sample period (which should be the same each round)
- Change the box width by altering the slider and then repeating steps 3-5 at least five more times.
Data Analysis
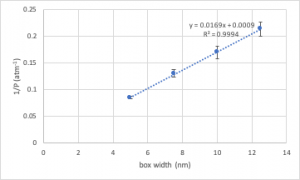
In this case, we wish to plot (a)  as a function of box width (a measure of volume), and (b) 1/(number of collisions) as a function of box width. In making these plots, you must incorporate appropriate measures of uncertainty, which we can roughly specify as a standard deviation. These are then incorporated in as error bars, as shown on the following example plot:
 given the error in pressure, you need to find the fractional error in and then
This video demonstrates how you would create these plots using Microsoft Excel:
https://iu.mediaspace.kaltura.com/id/1_9vaqn1yy
Relationship Between Volume and Temperature
In this experiment, you will study the relationships between volume and temperature using Gary Bertrand’s Gas Properties simulation. Select the Charles’ Law tab and complete the following.
- Select your assigned gas as follows (by the first letter of your last name):
- A-G: helium
- H-N: argon
- O-Z: nitrogen
- Select pressure control so the pressure is kept constant. Record the pressure in the container.
- Record the volume (in L) and temperature (in °C) in the container.
- Tweak the gears near the top of the piston to change the volume. Record the volume and temperature. Repeat this until you have a reasonable range of values.
- There are a number of different unit systems by which the ideal gas law can be used; for our purposes we will stick to the one used in most general chemistry textbooks. ↵
- Different books state these slightly differently, with different numbers of postulates; however, the contents should be the same. ↵
- From a physics perspective, without a collision, there will be no external force and hence the momentum is conserved. ↵
- Tro, Chemistry - A Molecular Approach (5th ed), Ch. 6.8. ↵
