
7 Kinetics of the Iodine Clock Reaction
Purpose
Determine the rate law and activation energy of an iodine clock reaction.
Learning Outcomes
- Calculate the rate of reaction given experimental data.
- Use the method of initial rates to determine the rate law and rate constant for a reaction.
- Graphically determine the activation energy of a reaction using the Arrhenius equation.
Introduction
In this experiment, you will study the rate of the reaction
(1) 
proceeds as a function of reactant concentration and as a function of temperature.
General Principles Associated
Defining the Rate of Reaction
The rate of a reaction is related to the change irange of soln concentration (in terms of molarity) of reactant/product present per unit time. That is to say, for the reaction
(2) 
the rate of reaction is given by
(3) ![\begin{equation*} \mbox{rate} (\unitfrac{M}{s}) = -\frac{\Delta [\ce{A}]}{\Delta t} = + \frac{\Delta [\ce{B}]}{\Delta t} \end{equation*}](https://iu.pressbooks.pub/app/uploads/quicklatex/quicklatex.com-31b83d5605012223ad66e525d044c890_l3.png "Rendered by QuickLaTeX.com")
Key points
- When you are dealing with the change in concentration of a reactant, a negative sign is placed in front. This ensures that the rate of reaction is positive.
- In order to ensure that the rate of reaction has the same numerical value regardless of the reactant/product being studied, the rate of change of concentration of a species is divided by its coefficient in the expression for the rate of a reaction
Example
For the reaction
(4) 
the rate of reaction can (equally) be expressed in terms of the change of concentration of N2O4 or NO2 as
(5) ![\begin{equation*} \mbox{rate} = -\frac{\Delta [\ce{N2O4}]}{\Delta t} = \frac{1}{2} \frac{\Delta [\ce{NO2}]}{\Delta t} \end{equation*}](https://iu.pressbooks.pub/app/uploads/quicklatex/quicklatex.com-ea10fe3fc74343b20f4dc1378b5a1847_l3.png "Rendered by QuickLaTeX.com")
Rate Laws
The dependence of reaction rates on concentration can be summarized by rate laws, which take the formy
(6) ![\begin{equation*} \mbox{rate} = k[\textrm{A}]^m[\textrm{B}]^n \cdots \end{equation*}](https://iu.pressbooks.pub/app/uploads/quicklatex/quicklatex.com-2b43eb43c622789c0103ea3eaa34d73c_l3.png "Rendered by QuickLaTeX.com")
where
 , the rate constant, is a function of the temperature of the reaction mixture.
![[\ce{A}],[\ce{B}],\cdots](https://iu.pressbooks.pub/app/uploads/quicklatex/quicklatex.com-091635f16a0db044e82c6a6cfe6ff1b4_l3.png "Rendered by QuickLaTeX.com") refer to the molarities of reactants or catalysts.[1]
refer to the molarities of reactants or catalysts.[1] are the rate orders with respect to each species. The rate orders will either be integers or simple fractions.
Rate laws cannot be found simply by reading off the balanced chemical equation. The only way to find rate laws is by conducting experiments, for which there are several methods. In this experiment, you will use the method of initial rates to determine the rate law for the iodine clock reaction.y
Effect of Temperature on Rates of Reaction
In accordance with collision theory, there are two reasons why reactions occur at a faster rate at higher temperatures:
- Molecules move at a faster speed.
- A greater proportion of molecules have sufficient energy to react when they collide.
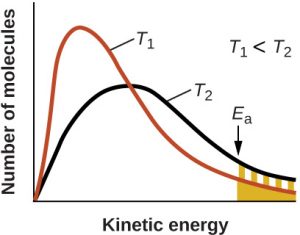
In reality, the second effect is the more important one. As a result, the temperature dependence of the rate constant can be given by the Arrhenius equation:
(7) 
where  is the frequency factor,
  is the \emph{activation energy (in J/mol} (the minimum amount of energy required for a collision to lead to reaction),
  is the ideal gas constant and
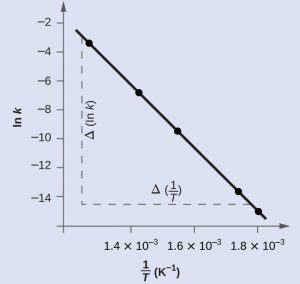
  is the temperature in Kelvins. This equation is better used in its straight-line form
(8) 
and hence by plotting  along the
  -axis and
  (with temperature in Kelvins) along the
  -axis, one will yield a straight line plot. For this straight-line plot, the slope of the graph is related to the activation energy by
(9) 
The Iodine Clock Reaction
In this experiment, you will study the iodine clock reaction between iodate and iodide under acidic conditions:
(10)
The iodate ion here would turn purple in the presence of starch. To create the effect of the iodine clock such that the starch would not turn purple immediately, a known, small amount of arsenic acid ( ) is added to the reacting mixture, which reduces the iodate back into iodide:
(11) 
This reaction occurs at a very fast rate, and the concentration of  is much lower than any of the other reactants. As a result, the reaction can be approximated as occurring at the initial concentrations of the three reactants. Furthermore, the time elapsed between mixing and the appearance of the dark purple color,
  , due to the emergence of
  is the time required for all of the
  to be consumed. Therefore, in time , the change in concentration
 ![\Delta[\textrm{H}_3\textrm{AsO}_4] \approx [\textrm{H}_3\textrm{AsO}_4]_0](https://iu.pressbooks.pub/app/uploads/quicklatex/quicklatex.com-7f444180af39308ec99b2341607d5207_l3.png "Rendered by QuickLaTeX.com") , the initial concentration of the arsenic acid.
, the initial concentration of the arsenic acid.
From the stoichiometric coefficients of the equation for the consumption of , we can see that
(12) ![\begin{equation*}\Delta [\textrm{H}_3\textrm{AsO}_4] = \Delta [\textrm{I}_3^-]\end{equation*}](https://iu.pressbooks.pub/app/uploads/quicklatex/quicklatex.com-491130f4d3a94d7b31fcb500da34d807_l3.png "Rendered by QuickLaTeX.com")
and looking at the stoichiometric coefficients of the iodine clock reaction,
(13) ![\begin{equation*}\textrm{rate} = \frac{1}{3} \frac{\Delta [\textrm{I}_3^-]}{\Delta t}\end{equation*}](https://iu.pressbooks.pub/app/uploads/quicklatex/quicklatex.com-72f38045f62abb65b9da590a3eb14cb8_l3.png "Rendered by QuickLaTeX.com")
and putting all of this together, we can show that the reaction rate is
(14) ![\begin{equation*}\textrm{rate}= \frac{1}{3} \frac{[\textrm{H}_3\textrm{AsO}_4]_0}{\Delta t}\end{equation*}](https://iu.pressbooks.pub/app/uploads/quicklatex/quicklatex.com-f0b688804a6c01bc46ba1ab5c671fd5e_l3.png "Rendered by QuickLaTeX.com")
You can therefore, by varying the initial concentrations and temperatures in each of the tubes, determine the rate law. From this, you can determine the rate constants for the reaction at different temperatures, and hence determine the activation energy for this reaction.
Experimental Procedure
In this experiment, you will use Dr. Gary Bertrand’s virtual lab setup to obtain simulated data associated with this reaction. Click on the Experiment tab to proceed.
You can vary independently the concentrations of each of the reactants as well as the temperature. The initial concentrations at the instant of mixing (before any reactions occur) will appear on the right hand panel of the reaction system. It is incumbent upon you to select a number of different set of solution concentrations and conditions to make the experiment work for you.
Determination of the Rate Law
For this part of the experiment, you will set up each of the concentrations at a particular temperature that works for you. Record the initial concentrations and conditions upon mixing, and then select “mix the solutions” to make the lab bench setup appear.
-
Select start to mix the solutions and start the stopclock. You will see the two solutions being mixed in the video screen.
- Wait and watch carefully until the instant the solution starts showing purple. Hit “stop” to stop the stopclock.
- Hit “reset” to go back to the state just before mixing so you can repeat the experiment. For each set of conditions, please be sure to repeat this at least three times.
To prepare another mixture, go to “prepare solution”.
Determination of the Activation Energy
To determine the activation energy, you will need to have a set of conditions from which to vary the temperature.
Repeat the above experiment for one set of concentrations of solutions, but be sure to do it for every temperature.
- Sometimes, you can see concentrations of products or very rarely concentrations of intermediates that exist in this reaction. For most purposes, however, intermediates will not likely appear in the rate law. ↵