
28 Geographic Shifts in Florida Citrus Growing
GEOGRAPHIC SHIFTS IN FLORIDA CITRUS GROWING
Frederick L. Bein
University of Florida
Introduction
Citrus was first brought to Florida by the Spanish in the sixteenth century. Native Americans distributed it to other parts of the peninsula where it thrived in a wild state until the first Anglo settlers began the cultivation in the early nineteenth century.1 Commercial Citrus was initially located along the Saint Johns River and Tampa Bay where waterways afforded transportation to markets. The Saint Johns River area developed rapidly as a production center, the east coast location making it more accessible to the northern markets of the United States and Europe.
 Semi-wild citrus growing along the Saint Johns River 1971 by Rick Bein

Railroad construction in the 1880’s and 1890’s provided transportation to other ports of Florida. An enlarged market for citrus fruit in northern cities was met with increased production in Florida. A general expansion of citrus lands followed, mostly to the south of the earlier producing areas. Since that time, the citrus growing areas of Florida have been shifting to more southerly locations on the peninsula. At the present time little citrus is produced along the lower Saint John’s River where the initial boom took place.
The purpose of this paper is to measure the shifts in the growing areas, past and present, and to determine some reasons why these shifts occur.
Statistical information on the location of citrus groves is available as early as 1880 from the United States Census of Agriculture. This was county data of acreages planted and boxes harvested, and until recently all information has been presented in this manner. County information poses a problem of measuring areal distributions as variation in county size makes it difficult to establish standard size units of production. There is a need for a smaller standard size area for more precision measurement and comparison of relative concentrations of citrus cultivation. One way of creating such a standard areal unit would be to superimpose on the map of Florida a set of uniformly spaced grid lines. (See figure 2.) Thus, the State may be divided into equal area square blocks without reference to the county boundaries. Values assigned to the blocks are derived by noting how many blocks coincide with the county area. The county citrus statistic is then divided by the number of blocks occurring within its border, the quotient providing the value assigned to each of these equal area units. General concentrations of citrus can be shown on a map of Florida though concentrations within the county may be distorted. Information gathered in the last decade by the U.S. Government Agency, Florida Crop and Livestock Reporting Service, is available by township, which provides an equal area unit in itself and makes measurement more accurate.
Measuring the areal distribution of Florida citrus production can be achieved with various Centro-graphic techniques by computing the median center, mean center, standard distance, and average distance as developed by Bachi and Neft.
For the purpose of this paper, the mean center is used as it provides the best measure of geographical centrality in terms of areal distribution and density. It reflects shifts in citrus acreages which would not be demonstrated so well by a median. The range in areal distribution of citrus has changed very little over the last century and, therefore, would not be very expressive. Computing a standard distance from the mean center could also have been done for the paper, but that would require a bell shaped or normal curve for each axis in order to be meaningful. A normal curve does occur along the North-South axis, but not along the East-West. Mean centers of Florida citrus production can be computed from the grid overlay by employing a method similar to that described by John Frazer Hart in his article, “Central Tendency in Areal Distributions,” in Economic Geography, Volume 30, Page 48-xx, 1954.
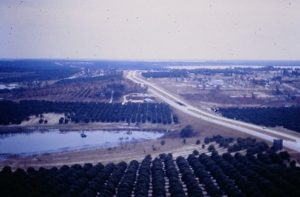
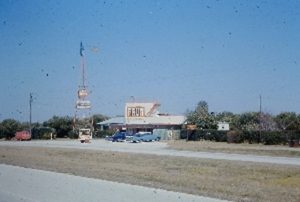
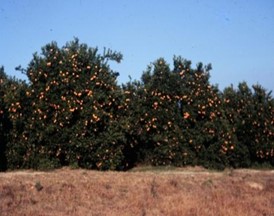
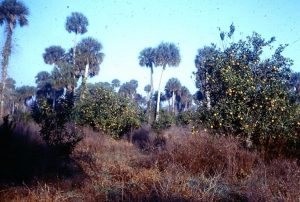
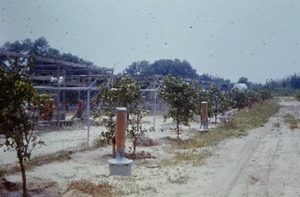 Images of Florida citrus by Rick Bein 1971. Citrus landscapes: Interstate Highway winds through the citrus groves; Fruit stand beside a rest stop; healthy citrus grove; Diesel fuel smudge pots used to heat the groves during freeze.

Rows and columns of equal squares are formed by the grid overlay. Vertical and horizontal mean locations are established for each decade.
The values of all the squares in one row are totaled, the same being done for the columns. These totals are compiled along the corresponding vertical and horizontal axes of the grid. Location values in ascending order along each axis are assigned to the rows and columns. The location assignment and the citrus acreage for each row and column are multiplied, giving a series of weighted values along each axis. Those weighted values are totaled for each axis and divided by the total Florida citrus acreage for the particular year. The resulting quotients are the mean coordinates for their prospective axes. Where the two coordinates intersect on the map determines the mean center of the citrus acreage in Florida. Above grid shows the mean locations of citrus for each decade since 1880. The mean for 1900 is not shown because there was limited citrus production following the freeze of 1894. See next map.
In 1880 the mean center was located on the Putnam and Marion County line at latitude 29½° North. By 1910 the mean center moved to about the 28th parallel in Polk County where it has changed little since.
Shifting Centers of Citrus
Given that the mean center of Florida citrus production has been shifting southward, the concern now is, “Why has this shift taken place?” Approaching this problem in terms of economic reasons the cost and returns of citrus production have to be examined. Since the concern involves the location of citrus concentration over a given space, those economic factors that have the greatest variable that is fairly uniform through the State of Florida would not be indicative of why certain concentrations occur. Therefore, variables with the greatest areal differential must be those examined. Initially, Florida citrus was located in the north as transportation facilities were only located there, and in other words transportation costs increased to the south. When the railroads were extended, citrus acreage increased in the south. Differences in the cost of transportation decreased and, as a factor of increasing variable costs, became insignificant relative to location.
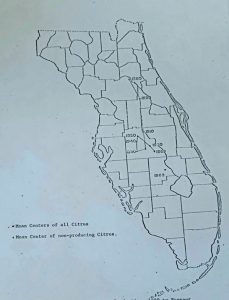
Mean centers of Citrus Production 1880 to 1970
The price of citrus in Florida is fairly standard throughout the state and need not be considered further. Observing the cost structure of Florida citrus production, several factors appear to have greater areal variation. Most obvious of these are the costs of purchasing citrus land, cold protection costs, the cost of soil drainage and competitive land uses. Gold protection costs is the variable that is examined in this paper because it is most often expressed by the citrus growers as a determinant in location and has the greatest variability extending from north to south in Florida. The average total cost of citrus production in Florida is around $300.00 per acre per year, of which cold protection costs are as high as twenty percent in the northern producing areas and as low as zero percent in the south.

Problems of Cold Temperatures
Citrus is a tropical fruit which cannot endure long periods of temperature below freezing. It is therefore either cultivated where cold weather is not a problem or where air temperature can be controlled by heating. Geographers are, of course, aware of the differences between cold caused by the advance of cold fronts and cold caused by radiation inversions. Average grove managers also recognize these differences, though sometimes with different vocabulary: a freeze and a frost. Heating citrus groves during a freeze sustains the crops in what would otherwise be a limiting environment. Heating is an added cost of production and is only profitable if the price of citrus fruit is high enough to offset the expense.
It would be expected, assuming citrus prices are controlled by a competitive market, that growers who can operate at lower costs (of which cold protection costs represent a considerable fraction) are better able to sell their fruit at lower prices than are those growers with higher costs. The former is able to maintain a profitable enterprise, while the latter are not able to compete. Citrus production then adjusts its location to areas of lower cold protection costs, provided other limiting factors such as land costs, and soil deficiencies are not significant.
With this assumption, it follows that citrus production would tend to shift southward in Florida as lower temperatures and costs of cold protection decrease. Also, this assumes there has been little if any secular changes in climate. Figure VIII shows the average annual number of hours when air temperatures 24°F. or lower were registered between 1937 to 1967. (24°F. is the critical temperature of which grove heating must begin or else damage to trees and fruit results.)
A detailed schedule of present cold protection cost shows a breakdown of costs to a per hour value. (Once expressed in cost per hour it can be applied to figure 5 with the average cost of cold protection per year calculated for each isoline. A cost surface map of cold protection as a result is presented.

Cost surface map: Average acre cold protection costs for growing citrus in Florida, 1937-67.
The cost surface map of cold protection shows that citrus would more likely be located in southern Florida if the growers are more concerned with cost of cold protection than with other costs. This assumes the southerly adjustment of citrus production has not yet reached its limit, and there is an elastic demand for citrus products, mean prices of citrus products are sensitive to changes in their supply. Human decisions play an important role in the location of citrus groves. If the citrus market is expanding, the production would also increase either by intensifying existing citrus lands or by occupying new lands. With continual advances in technology, such as increasing the yield per tree or per acre, it is conceivable the southerly shift in citrus may never take place. If, however, citrus technology is oriented towards utilizing the swampy lands of southern Florida for groves, the shift is more likely to take place.
There has been considerable expansion of citrus lands to southern Florida in the last ten years. Measuring the magnitude of this is done by computing the mean location of newly planted citrus acreages. Newly planted citrus or non-bearing citrus for the purpose of this study are the trees planted since 1962. Non-bearing citrus refers to citrus plantings which have not reached the full producing potential which occurs when the trees reach the age of somewhere between five to ten years. The 1962 cut-off date is used because the last big freeze affecting Florida citrus came in December of 1962. Most of the recent plantings in the south are said to have followed this devastating freeze.
The mean location of non-bearing citrus in 1969 in Highlands County is fifty miles south of the traditional production center in Polk County. This is important because non-bearing trees reflect future production areas, and, therefore, should be located where new citrus concentrations are expected to develop. If such an assumption is valid, then the available evidence points to a shift southward.
Significance of the Shift Relative to Cold Protection Costs
The relationship of the location of citrus, old and new areas, with respect to cold protection costs is measured by the use of the chi square (x2) test. Bearing and non-bearing citrus are differentiated because the bearing acreages reflect current production, while non-bearing acreages relate to future production. Each test is set up dividing both the bearing and non-bearing acres with a cold protection cost surface map isoline. Four cells are established: 1) the number of bearing citrus acreages located with cold protection costs greater than on the isoline, 2) the number of bearing citrus acreages located with cold protection costs less than on the isoline, 3) the number of non-bearing citrus acreages located with cold protection costs greater than on the isoline, and 4) the number of non-bearing citrus acreages located with cold protection costs less than on the isoline.
The cost of cold protection per acre per year as presented on the cost surface map of Florida is based on the Florida isoline map of hours of temperature 24°F. or lower per year. It is computed by the following method: (The 1.56-hour isoline is used as an example.)
| Costs | Minimum | Maximum |
| Equipment depreciation @ $20 per acre year
(Based on 20years/$400 initial cost) |
$20.00 | $20.00 |
| Fuel Costs @ $4.50 to $6.75 per acre hour
(x1.56 hours) |
7.00 | 10.50 |
| Labor Costs @ $2.00 per man hour
(x1.56 hours x .4 hours/acre) |
1.25 | 1.25 |
| Totals | $28.25 | $31.75 |
(min. + max.)/2 = $30.00 average cost per acre per year.
The formula: $20.00 + 6.425h = c., Where h is hours of temperature 24°F. or lower and C is the cold protection cost value at a given temperature intensity computes the cost surface map.
The chi square test is to set up to show the relationship of citrus acreage and cold protection costs for any isoline on the cost surface map. This study tests the relationships of two isolines, $25.00/acre/year cost line, and $30.00/acre/year cost line, with respect to the location of the two citrus age groups. These isolines are selected because they generally pass through the mean center of the last fifty years of citrus production in Florida and would best reflect shifts in any direction away from the mean.
The number of bearing and non-bearing citrus trees located with respect to greater or less cold protection costs per year than $25.00 in 1969.
| Cold Protection Costs
Relative to $25.00 Per Acre/Year |
Bearing Acres (1000) | Non-Bearing Acres (1000) |
Total |
| $25.00 | 191;307 | 191;669 | 383;006 |
| 25.00 | 468;353 | 118;548 | 586;901 |
| 659;660 | 310;247 | 969;907 |
x2 = 9.4935 with one degree of freedom
The number of bearing and non-bearing citrus trees located with respect to greater or less cold protection costs per year than $30.00 in 1969.
| Cold Protection Costs
Relative to $30.00 Per Acre/Year |
Bearing Acres (1000) | Non-Bearing Acres (1000) |
Total |
| $30.00 | 296;120 | 220;239 | 516;359 |
| 30.00 | 363;540 | 90;008 | 453;548 |
| 659;660 | 310;247 | 969;907 |
x2 = 5.7735 with one degree of freedom
The relationship of citrus acreage location and cold protection costs is resolved by the use of null and alternative hypotheses.
HO: The location of bearing and non-bearing citrus acreages is independent of cold protection costs.
HA: The location of bearing and non-bearing citrus acreages is not independent of cold protection costs.
The minimum level of significance accepted in this study is the 0.05 level. Both tests show a significant relationship between cold protection costs and the location of bearing and non-bearing citrus as they disprove the null hypothesis at the 0.05 level of confidence, with the $25.00 isoline actually reaching the 0.005 level and the $30.00 isoline reaching 0.025. In other words, there is better than ninety five percent probability that the location of the citrus acreage, differentiated according to bearing and non-bearing trees, can be attributed to whether cold protection costs are above or below the value of the isoline chosen.
Cold protection costs factors are an important element in the shift of Florida citrus, though other cost variables may play an important role in the new location. This study with its various assumptions has shown the influence of cold protection costs upon the expansion of the Florida citrus growing areas.
Determining cold protection cost.
Based on an interview with Dalton Harrison, Agricultural Engineering, University of Florida,
May 22, 1970.
The initial cost of installation of wind machines or heaters is $400.00 per acre. The use of wind machines is only effective against frost inversions while grove heaters are more effective against cold fronts. In order to obtain 1 to 3 degrees F. protection, 5,000,000 BTU’s or 36.23 gallons of diesel per acre per hour must be used to achieve 100% efficiency. However, 100% efficiency is rarely obtained, and most grove heating is at 80% efficiency, which raises the expenditure value to forty-five gallons per acre per hour. The 1970 cost of one gallon of number two diesel fuel is between ten and fifteen cents. This makes a fuel cost that ranges from $4.50 to $6.75 per acre hour. The cost of labor for grove burning at the present time in Florida is $2.00 per man hour. One person can tend two and one-half acres per hour, costing eighty cents per acre hour.

Citrus growing areas in Florida 1969.
BIBLIOGRAPHY
Ackerman, A.C. “Influences of Climate on the Cultivation of Citrus Fruits”
Geographical Review. 28:289-302, April 1930.
Bachi, R. “Standard Distance Measures and Related Methods for Spatial
Analysis,” Regional Science Association, Papers x (1962) pp.83-132
“Commercial Citrus Inventory,” Florida Agricultural Statistics. Orlando, Florida:
Florida Crop and Livestock Reporting Service, September 1968.
Conner, Commissioner Doyle. The State of Florida Citrus. Bulletin No.177.
Florida Department of Agriculture, June 1969.
Florida Citrus Fruit. Annual Summary. Orlando Florida: Florida Crop and
Livestock Reporting Service, Vols. 1-22, 1948-1969.
Florida Citrus Industry After the Freeze. Coral Gables, Florida: Meredity &
Toblin Research Co., Marketing & Economic Research Co., 1964
Found, William Charles. The Distribution of Citrus Land in Orange County,
Florida. M.A. Thesis. Gainesville, Florida: University of Florida, August 1964.
Gerber, J.F. And Martsolf, J.D. Protecting Citrus from Cold Damage. Circular
- Gainesville, Florida: University of Florida. Personal interview. May 22, 1970.
Harrison, Dalton. Department of Agricultural Engineering, University of Florida.
Personal interview. May 22, 1970.
Hart, John Fraser. “Central Tendency in Areal Distributions,” Economic
Geography. 30:48-59, 1954.
Hume, H. Harold. The Cultivation of Citrus Fruits. New York: The MacMillan
Company, 1934.
Mayo, Commissioner Nathan. Citrus Industry of Florida. Bulletin No.2.
Tallahassee, Florida: Department of Agriculture, October 1941.
Mead, A.R. The Citrus Industry and Occupations in Florida. National Youth
Administration for Florida, Joe A. Youngblood, State Youth Administrator, 1939.
