16 Analytics
As the admin for your sub-catalog, you have access to data about student behavior in all the courses in your catalog.
The types of data you can view include:
- Enrollments
- Revenue
- Student completions
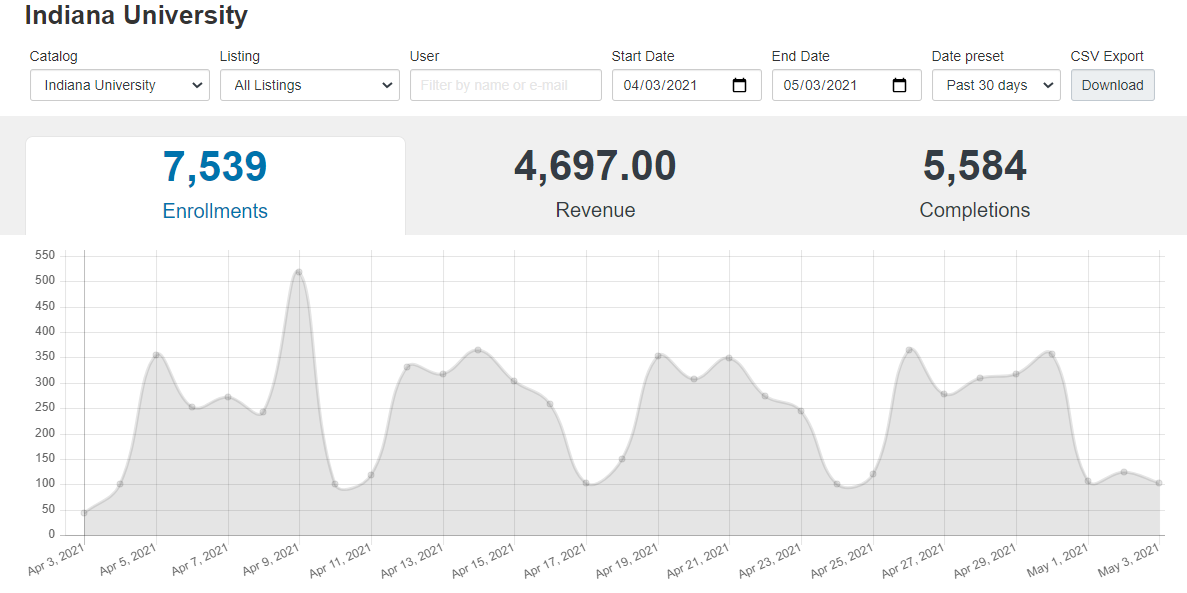
Example dashboard
Viewing Your Analytics
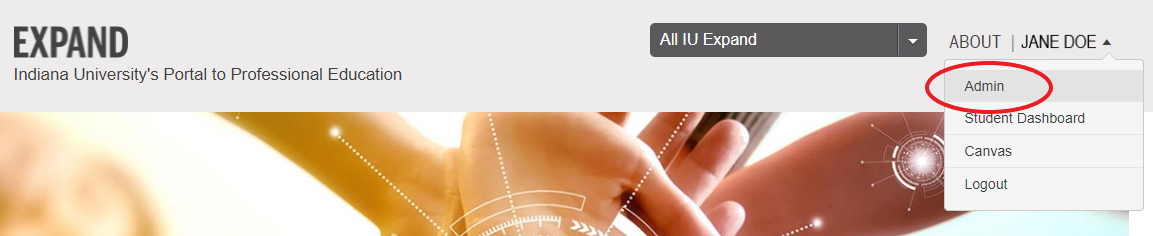
To access the analytics for your sub catalog, sign in to IU Expand and navigate to the Admin area using the drop-down menu below your name.
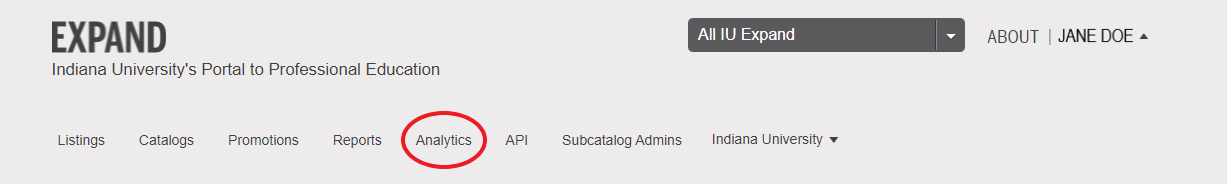
Click on the Analytics tab to navigate to your sub catalog’s dashboard.
Filtering the data
By default, the dashboard displays data for your entire catalog from the last 30 days. You can filter this data to show a specific listing using the Listing drop-down tool in the dashboard toolbar. You can also filter the data to include a different time period. Use the Start Date and End Date fields to search for a specific time period. Use the Date Preset drop-down to search by preset options:
- Today
- Past week
- Past 30 days
- Past year
- All time
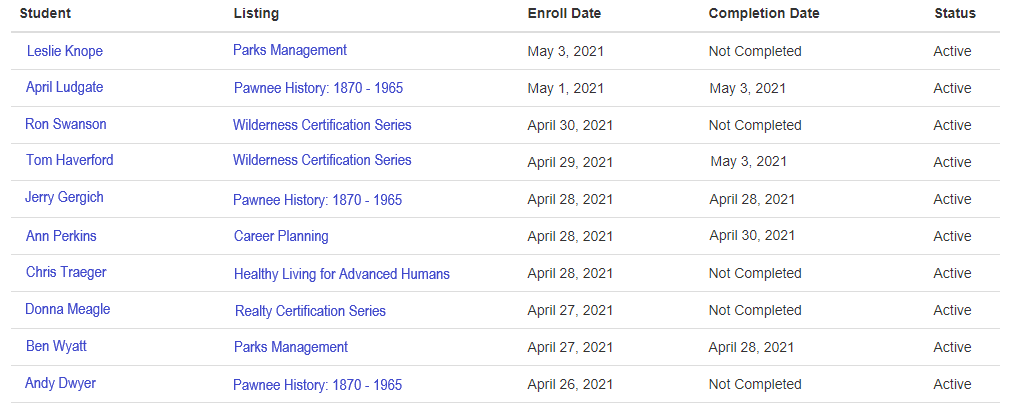
Enrollment and completion data
Beneath the dashboard is a complete list of student enrollment and completion data. It includes:
- student name
- listing the student is enrolled in
- student’s enrollment date into the course
- student’s completion date (Completion is determined by the module requirements in the Canvas course)
- student status