
Analytics in minutes – are students watching course videos?
<10 min.
![]() NOTE: Kaltura data can only reliably indicate that something happened (e.g., a student clicked the play button). It cannot prove that something didn’t happen (e.g. that a student didn’t watch a video).
NOTE: Kaltura data can only reliably indicate that something happened (e.g., a student clicked the play button). It cannot prove that something didn’t happen (e.g. that a student didn’t watch a video).
- Navigate to https://kaltura.iu.edu and Log in.
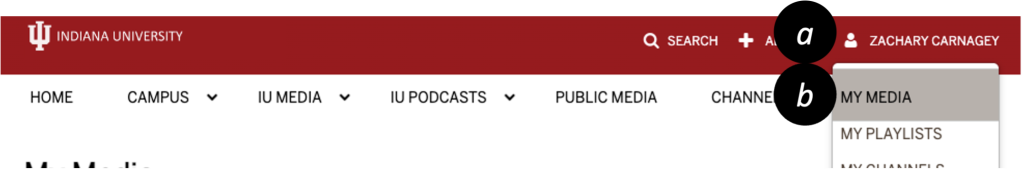
- Click your name [a] then select My Media [b].
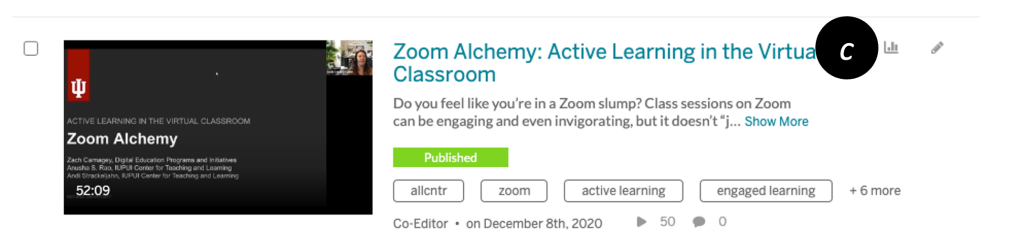
- Scroll down to the video you wish see, and click on the View analytics icon [c] next to the title.
- Click on the date range [d], and select a Preset or specify a date range. Click Apply when finished.

- Analyze your view data. Consider triangulating the view-data with anonymous student surveys to get a more accurate picture of student behavior.
Pro Tip: Decoding Kaltura Analytics
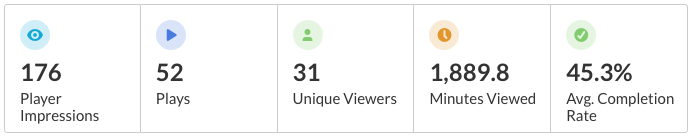
Player Impressions – How many times the Kaltura player has loaded on a page.
Plays – How many times the Play button has been pressed. Pausing and resuming is not counted as additional Plays.
Unique Viewers – Number of unique individuals who have pressed the Play button at least once.
Minutes Viewed – The total number of minutes played across all viewers.
Avg. Completion Rate – Average percentage of completion, across all plays.