
Analytics in minutes – Which course resources were used?
< 5 minutes
Note: As with all analytics, Canvas data can only reliably indicate that something happened (e.g., a user clicked to a page or opened a file). It cannot prove that something didn’t happen (e.g., that a student didn’t read that page).
- Log in to a Canvas course.
- Click on Reports and Dashboards in the left navigation. In the “New Analytics” card select Open Report.
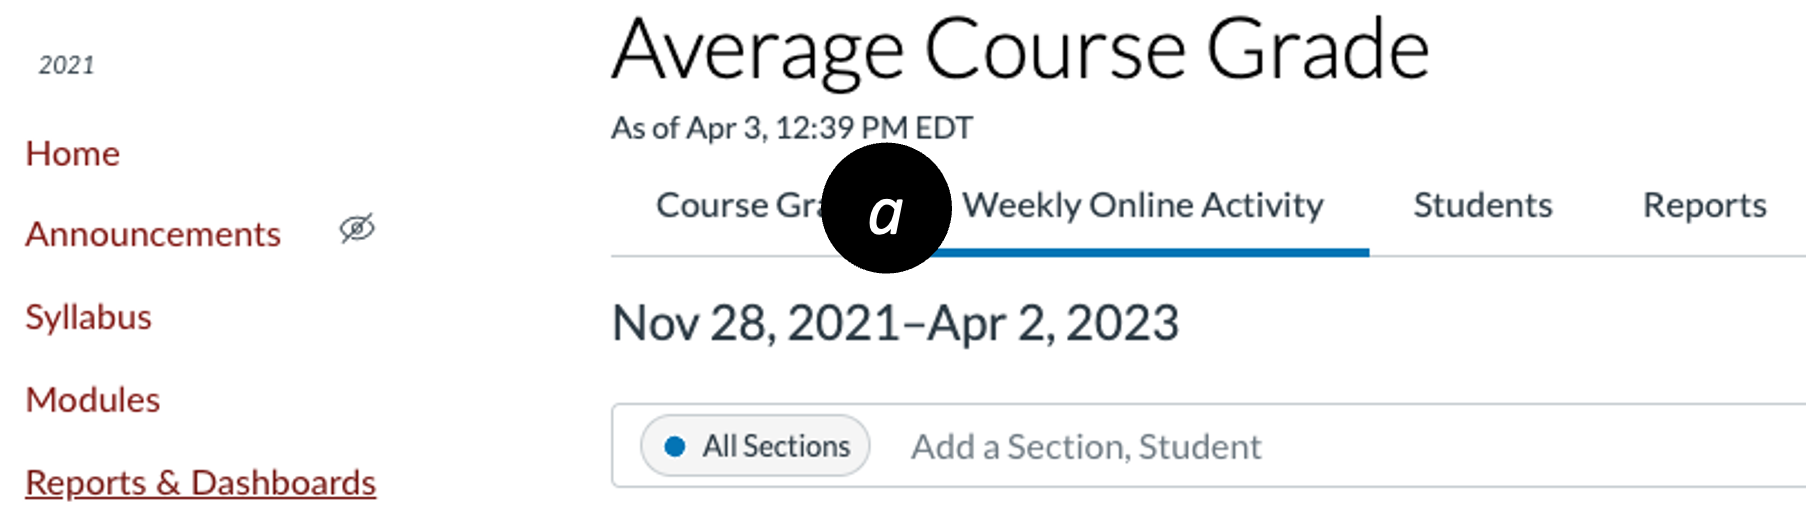
- Select Weekly Online Activity tab [a], and scroll down to the Resources table.
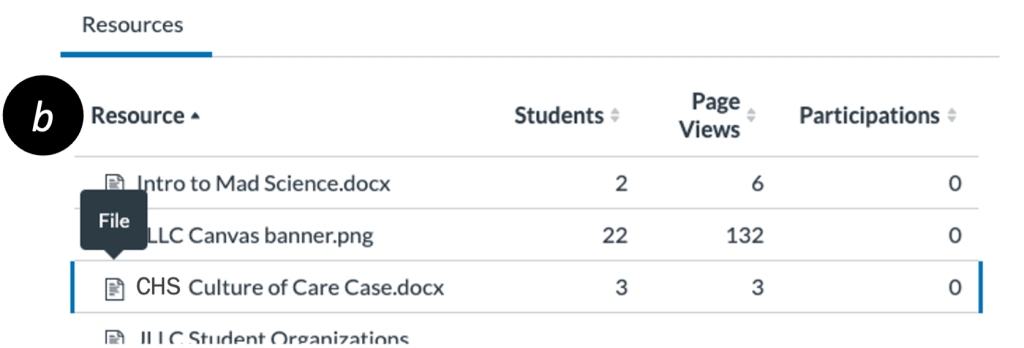
- Click Resource [b] to sort and group by resource type (e.g., Assignments, Discussions, Files, etc.).
- Scroll down the table to where files are listed, indicated by
 . Review the number of students and page views for the different resources. Consider whether files with few views are easy to find, necessary for completing assignments, or whether they’re supplemental.
- (optional) Click the table headers – Resource, Students, Page Views, or Participations – to sort the data in ways that reveal usage trends.
- Students – The number of unique users who accessed the resource.
- Page Views – The number of times a link to a resource/page was clicked.
- Participations – User actions such as submitting an assignment, starting a quiz, or commenting on an announcement or discussion.