
Using Laboratory Equipment
Here, we present how you might be able to use different types of laboratory equipment that is typically not in the drawer but are often used in the chemistry laboratory.
Spectrophotometers
Many chemical substances either absorb light (e.g. paint, food coloring, plant pigments) or scatter light (e.g. milk, groundwater suspension). In either event, the proportion of light transmitted will decrease significantly. This is described in Beer’s Law, where the intensity of light transmitted through a sample, [latex]I[/latex], is related to the initial intensity of light [latex]I_0[/latex] by
[latex]\frac{I}{I_0} = 10^{-A}[/latex]
where [latex]A[/latex], the absorbance, is related to the concentration by Beer’s Law:
[latex]A = \varepsilon bc[/latex]
where [latex]\varepsilon[/latex], the molar absorbance, depends on the sample and the wavelength of light used, [latex]c[/latex] is the concentration, and [latex]b[/latex] is the path length (typically 1 cm).
Cuvettes
We generally put samples for spectrophotometry in cuvettes. The plastic cuvettes used in the laboratory vary, but often have two sides that are clear and two other sides that are not. Some cuvettes have a completely square base, while other cuvettes are designed to have a smaller width below a certain height.[1] The plastic cuvettes used in this course are disposable and should be placed in the regular trash can after all chemical residue has been rinsed.
For a given experiment you must use the same type of cuvette consistently unless otherwise directed. It is also vital that the cuvettes are properly aligned in the direction of the light path. For the ones that are not perfectly square at the bottom, the cuvette would be placed such that the light path goes through the entire cuvette. For the others, most cuvettes are built such that two facing sides are transparent while the other two are not; you will need to find the two transparent sides and place the cuvette such that the light path goes through the transparent sides.
Before putting the cuvettes into an instrument, the clear sides must be clean; you should wipe them down with a Kimwipe before putting them in an instrument.
Vernier GoDirect SpectroVis Plus
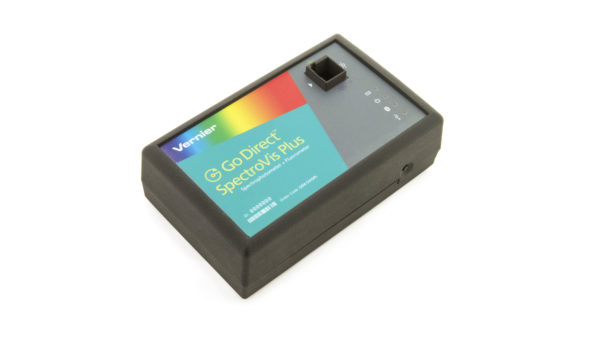
The Vernier SpectroVis Plus is a combined spectrophotometer and fluorimeter. There are a number of different modes by which you can use this. Here, we will discuss two different modes: obtaining the overall absorption spectrum and also obtaining the spectrum at a given time. Other than those features, specific directions will be given to you as needed for each experiment.
Software
Before you begin, you will need to have installed on your device (tablet/cellphone) the Vernier Spectral Analysis software. Either obtain it from the link or go to your device’s App Store. Bluetooth must also be enabled on your device.
Starting the Device
- Press the power button on the GoDirect SpectroVis Plus device. The Bluetooth LED will blink.
- Launch the Vernier Spectral Analysis app. Keeping the device close to your device, tap on Connect a Spectrometer. Select your spectrometer.[2]
- Place a cuvette with a solvent blank into your sample holder.
For this instrument, you must align the clear sides to the cuvette against the white arrow and the white light bulb symbol.
In all cases, for this device the linearity of Beer’s Law breaks down when the absorbance is above 1.00, which is lower than most instruments. If the absorbance is too high please consult your instructor.
Collecting Data
The procedure depends on the type of data being collected.
Determining the Absorption Spectrum
In this mode, you will be able to determine the absorption spectrum of a given sample throughout the visible range (400 – 700 nm).
- 4. Select “Absorbance vs Wavelength (Full Spectrum)”.
- 5. The system will automatically begin the calibration (zeroing) process. It will take about 90 seconds for the lamp to complete this process. When complete, click on finish calibration to complete this process.
- 6. Replace the blank cuvette with the cuvette containing the sample, and then allow the displayed spectrum to stabilize.
- 7. Click on Collect to start data collection. Once the actual spectrum stabilizes, click on stop to complete the data collection.
Determining the Absorbance as a Function of Concentration
To follow this procedure fully, you need to know the concentration of each sample before you put it into the instrument.
- 4. Select “Absorbance vs Concentration (Beer’s Law)”
- 5. The system will automatically begin the calibration (zeroing) process. It will take about 90 seconds for the lamp to complete this process. When complete, click on finish calibration to complete this process.
- 6. Enter the wavelength you plan to obtain the measurements, as per the directions on the lab manual.
- 7. Replace the blank cuvette with one of your samples, and allow the reading on the bottom right to stabilize. Click on Collect and then Keep to obtain the measurement. You will be prompted to enter the solution concentration each time you do this. As you go along, you will be able to see the Beer’s Law being formed. Record the data in your lab notebook.
- 8. Repeat step 7 until you have collected all the data.
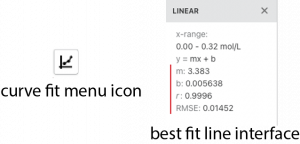
- 9. To obtain the best fit line, click on the curve-fit drop down menu button in the bottom left corner.
- 10. Select Apply Curve Fit. Make sure that linear is selected as the shape of the plot, and that the line on the screen appears to fit your data. If it doesn’t, please ask your instructor for help. A dialog box will then appear with information about the best fit line on the graph.
If you prefer to do the calculations later, follow these instructions but:
- For step 7, don’t press “collect” and “keep”; instead, just record the data in your lab notebook.
- Skip steps 9 and 10.
- You will then need to prepare the Beer’s Law plot after lab using Excel, by hand-plotting, or otherwise.
Determine the Absorbance as a Function of Time
This mode can be used to measure the absorbance of a sample kept in the spectrophotometer over time automatically. This is particularly useful for kinetics experiments.
- 4. Select “Absorbance vs. Time (Kinetics)”.
- 5. The system will automatically begin the calibration (zeroing) process. It will take about 90 seconds for the lamp to complete this process. When complete, click on finish calibration to complete this process.
- 6. Enter the wavelength you plan to obtain the measurements, as per the directions on the lab manual.
- 7. Place the cuvette in the spectrophotometer before both components are mixed together.
- 8. At the instant of mixing, click on collect to start data collection.
- 9. At the end of the kinetics experiment, click or tap stop and continue with data analysis.
Exporting the Data
In each case, you can collect the data from the computer automatically. Click on the paper icon at the top left corner and select “Export”.
- To save an image of the plot as you see it as a PNG file, select Graph.
- To save the numerical data as a CSV file (which can be imported into a spreadsheet program like Microsoft Excel), select .CSV.
Filtration
Filtration is a technique by which insoluble solids can be separated from the liquid phase (along with any solutes present). There are two main approaches by which this can be achieved:
Vacuum Filtration

Vacuum filtration is one of two filtration techniques routinely used in the chemistry laboratory. Here, we aim to speed up the filtration procedure by drawing a vacuum under the filter paper, thus drawing the liquid through more efficiently. It also leaves less liquid behind (contaminating the solid) than gravity filtration does. This means that as a general rule of thumb, vacuum filtration should be used if you want to collect the solid and discard the liquid. The vacuum can be provided in a variety of ways. At IU East, we will use water aspirators attached to the two lower taps on each sink to provide this vacuum.
- Ensure that all the glassware is clean and dry at the beginning of the experiment. If necessary, rinse the glassware with acetone and allow to evaporate.
- Place a ring clamp over the top of the side-arm flask and below the side-arm and attach it to a ring-stand to ensure that the side-arm flask doesn’t fall over during the vacuum filtration.
- Attach a Büchner funnel to the side-arm flask (vacuum/Büchner flask) that’s attached to the ring stand.
- Place a piece of filter paper in the Büchner funnel.
- Pour a small volume of the sample to be filtered onto the filter paper.
- In each sink, there is a water aspirator connected to each of the lower taps. On each aspirator, there is a side valve; connect the side-arm of the vacuum flask to the aspirator using a piece of vacuum tubing.
- Run the water tap; this will draw a vacuum through the filter, causing the sample to be filtered through the filter paper. Pour the sample into the Büchner funnel, being sure not to overfill the funnel. You may need to refill the funnel multiple times.
Gravity Filtration
Another way that filtration can be completed is using gravity filtration. Here, you use a conical filter funnel and pour the liquid into the filter. While slower than vacuum filtration, the lighter weight of the gravity filter may lead to lower heat losses when a hot sample is being filtered. There is also less of a chance of any of the solid being sucked through or around the filter and contaminating the filtrate (liquid after filtering). This means that as a general rule of thumb, gravity filtration should be used if you want to collect the liquid and discard the solid.
- Take out and place the conical funnel, placing it securely in a ring stand. Place a waste beaker underneath the funnel.
- Fold up a piece of filter paper into quarters and open up the cone so it looks like a cup.
- Place this cone into the filter, and place a small volume of what you plan to filter into the filter paper, in order that the base is soaked and the filter is in place.
- Place the collection vessel underneath the filter and then pour in the liquid into the filter, collecting the liquid carefully and ensuring that there is no solid in the filtered liquid.
Centrifuge
In many reactions and processes involving solutions, there will be two different components that we would like to separate. One of the products – the supernatant – will be soluble in the solvent (e.g. water), while the other product – the precipitate – does not dissolve in the solvent. Eventually, under gravitational attraction, the two components will separate out allowing for a relatively clean separation.
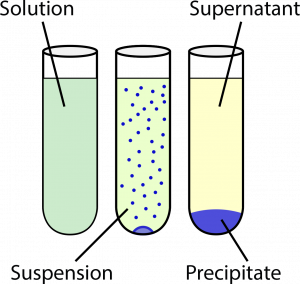
(C) a mixture where the insoluble component (precipitate) has separated out by sedimentation from the solution
(supernatant).
Sometimes, however, a clean separation is not obtained readily, and a suspension is formed. A centrifuge is used to separate out the supernatant from the precipitate, by using the centrifugal force from rotating the suspension at very high speeds.
Important Notes
In order to ensure safe operation of the centrifuge, there are a number of key rules:
- The centrifuge must have a balanced load, as explained below.
- Make sure that the centrifuge is closed before turning it on.
- Do not touch any moving parts.
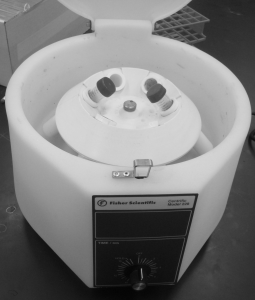
How to Use a Centrifuge
The centrifuges used in this course use small test tubes as centrifuge tubes.
- Make sure you have a balanced pair of tubes. The two tubes should have approximately the same amount of content. If you do not have a well-matched pair of tubes, you should get an empty centrifuge tube and fill it with water to the same level as the tube that you wish to spin down.
As centrifuge tubes will rotate and hence not remain in the same position, it is essential for you to label the tubes before placing them into the centrifuge. - Turn the black knob on top of the centrifuge lid counterclockwise to release the catch and open the lid.
- Place, in the round slots provided, the paired tubes such that the two tubes are directly opposite each other.
- There are two ways by which the centrifuge can be used, using the control knob on the front of the centrifuge.
- Turn the knob on the front clockwise, setting it for a specified time period. Normally, a time period of one or two minutes is sufficient for most solutions.
- If you believe that you won’t be centrifuging for more than a few seconds, it might be easiest to turn the knob counterclockwise and hold it until you finish spinning it down. This is most useful if you have a very small amount of liquid, or alternatively if it’s almost all separated, but a small amount of suspension remains in the supernatant.
In either case, do not touch the centrifuge until it has completely stopped. If the centrifuge itself wobbles, unplug the centrifuge immediately and, after it has stopped, inspect the contents. The most likely cause of this is that the centrifuge is imbalanced.
- After the centrifuge has completely stopped, and not before (do not use your fingers to touch any moving part!), open the lid to the centrifuge and inspect the contents in your centrifuge tubes. Remove all tubes and replace the cover when you are done.
pH Probes
In this course (and for most purposes at IU East), we use Vernier pH probes that are connected wirelessly to your own mobile device.[3]
Software
You will need Vernier Graphical Analysis installed on your device. Either obtain it from the link or go to your device’s App Store. You also need to ensure that Bluetooth is enabled on your device.
Connecting to the pH Probe
Press down on the power button on the pH probe. This will turn the LED red. After that, launch the Vernier Graphical Analysis program and select “Sensor Data Collection”. Hold the pH probe close to your device, and this will detect the appropriate device.
- If there is more than one probe nearby, your device may detect more than one probe. In this case, cross-check the serial number of your pH probe against the serial number shown on the app to make sure you are connecting to the correct probe.
- For other problems, please don’t hesitate to consult with your instructor.
Calibration
As a general rule, while pH probes often can have calibrations saved they must be re-calibrated every time you use one in order to be accurate.
The pH probe can be calibrated using two or three buffers, each with a known pH value. In general, for general chemistry, we use two pH values relatively far apart; however, this depends entirely on the pH range you are working with. The default values chosen here should work for most of your experiments. For more advanced purposes, it is better to use three (or more) pH buffers to calibrate the pH probe.
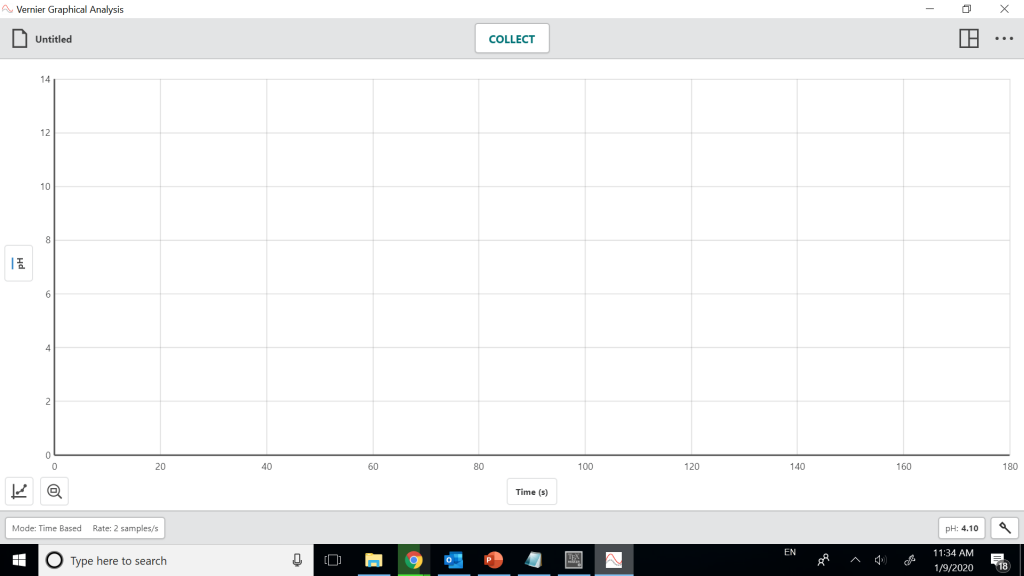
- Open up the Vernier Graphical Analysis software. It will show the data collection interface.
- Tap on the pH value that is shown on the bottom right hand corner. To calibrate the pH probe, select “Calibrate”.
- Select the appropriate type of calibration (two-point or three-point).
- Rinse the probe thoroughly with deionized water and place it into a test tube containing a buffer with a known pH value. The relative stability reading will change. Wait for this value to stabilize. Then, enter the pH value of the buffer in the text box and hit “Keep”.
- Repeat step 4 for each buffer you use to calibrate the pH probe.
- Click on “Apply” to store and use the new pH calibration.
Measuring the pH
Afterwards, to read the pH directly you can read it off the screen interface. To perform titrations:
Recording a Titration Curve
To record a pH titration curve using Vernier Graphical Analysis interface:
- At the bottom left hand side of the interface, click on the button where it says “Mode: Time Based Rate: 2 samples/s”.
- Select “Event Based” under Mode and name the event (e.g. volume NaOH added with mL as units). Click on “Done”. If you would like more accurate results, you may choose to click on Average sensor reading over 10 seconds.
- For the first reading, hit the “Keep” button and then enter the volume as appropriate.
- Make the change (e.g. deliver additional NaOH from the buret). Mix and make sure the pH probe reading is stable. Repeat step 3.
- Repeat step 4 until the titration is complete.
- Click on the paper icon at the top left corner and select “Export”. You can then save this as a .csv file, which can then be transferred to a computer and analyzed using Excel.
Micropipettes[4]
The ability to measure very small amounts, microliters (µl), of liquid chemicals or reagents is a fundamental skill needed in the biotechnology or research lab. Scientists use a device called a micropipette to measure these very small volumes with accuracy.
Remember, as with all fine motor skills, this new skill will require practice and determination. Be sure to operate the micropipette slowly and carefully, particularly since these are delicate, costly instruments.
There are several sizes of micropipettes used in the biotechnology lab. Most commonly, one will find P-1000, P-200, and P-10 micropipettes in the IU East laboratory. The P-1000 measures volumes between 100-1000 µl, the P-200 measures volumes between 20-200 µl, and the P-20 measures volumes in the 0.5-10 µl range.
As shown in the following figure, each micropipette has a similar but different display window. For the P1000, the red number indicates the thousands place, followed by the hundreds, tens, and the ones displayed as small vertical lines. Each line represents 2 µl. The P-200 is reads differently. The display from the top down reads, hundreds, tens, ones, and the vertical lines are considered 0.2 µl. Finally, the P-10 can be read from the top down tens, ones, and the red tenths.

To use a micropipet:
- Set the dial to the desired volume.
- Hold the micropipette in your dominant hand, and gently but securely place the end of the micropipette into the proper size tip (blue for P-1000, clear for P-10, and yellow for all other sizes). Once the tip is on, be careful not to touch the tip on anything! If your tip touches the bench, lab coat etc. eject the tip into the waste container and get a new clean pipet tip.
- Push the micropipette plunger down to the first stop and hold your thumb in this position.
- Place the pipet tip into the solution you’re measuring out.
- Gently release your thumb from the plunger to draw fluid into the tip.
- Confirm that the tip has liquid and that no bubbles are present within the tip.
- Gently touch the tip to the center of the circle labeled 5 µL and slowly push all the way down (to second stop) on the plunger to dispense the liquid.
- Dispose of the tip properly after you are done measuring that liquid.
- This is to reduce the volume of sample needed. ↵
- If you see more than one device, try and match the device ID, found near the barcode on the label. ↵
- While it is possible to use your computers with this, there remains a risk that you may spill chemicals onto your laptop. ↵
- This section was adapted from Lab Manual: Introduction to Biotechnology by the ASCCC Open Educational Resources Initiative (Orange County Biotechnology Education Collaborative) ↵
