
19 Buffers, Indicators, and Solution Standardization
Purpose
To explore the properties of buffers and indicators, and to review experimental techniques associated with acid-base titration
Expected Learning Outcomes
After completing this experiment, students are expected to be able to
- Calibrate and use a pH meter.
- Prepare and recall the properties of a buffer solution.
- Select appropriate indicators for use in a titration.
- Prepare and standardize a solution of sodium hydroxide.
Textbook Reference
From Tro, Chemistry: Structures and Properties, 2nd Ed:
- Buffers are discussed in Ch. 17.2-3.
- Indicators are discussed in Ch. 17.4.
- The preparation and standardization of acidic and basic solutions was conducted previously in CHEM-C 125.
Introduction
Buffers
Buffers are formed by mixing together similar amounts of weak acids and their conjugate base, such that
[latex]0.1 < \frac{[\mbox{base}]}{[\mbox{acid}]} < 10[/latex]
The pH of a buffer solution can be calculated using the Henderson-Hasselbalch equation.[1]
\begin{equation}
\mbox{pH} = \mbox{p}K_a + \log_{10} \left(\frac{[\mbox{base}]}{[\mbox{acid}]}\right) \label{414:HH}
\end{equation}
Indicators
Indicators are weak acids that absorb different colors in their acid and conjugate base forms. In environments with different pHs, they have different colors.[2]
Examples
Phenol red changes color from yellow at pH 6 to red at pH 8:
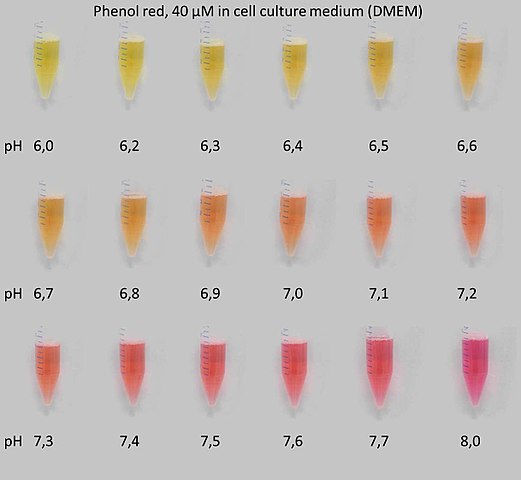
As part of this experiment, you will examine the colors of different indicators at different pHs. You may have used indicators before for standardization of acid and base solutions.
Standardization of Acids and Bases
Often, it is vital that the concentration of solutions are critical for human life. These are often determined using various titrimetric and other analytical techniques. In these cases, it is vital that reference solutions be prepared accurately.
Examples
The concentration of chloride ions in water is typically determined by titration with silver, using the precipitation of silver chloride as a standard.
\begin{equation}
\ce{Ag+}(aq) + \ce{Cl-} (aq) \rightleftharpoons \ce{AgCl}(s)
\end{equation}
When this is performed, it is vital that the concentration of silver ions in the analyte (we typically use the water sample as the titrant) is known accurately.
For acid-base experiments, the challenge is even greater. The solid form of many acids and bases are hygroscopic; they will absorb water from the ambient environment. This is true in particular for sodium hydroxide, which will form swollen pellets that may clump together as it absorbs moisture from air:

For this reason, specific primary standards of acids and bases are used to determine the concentration of other acids and bases using titrimetric methods rather than simply by dissolving the appropriate mass of solution.
In this experiment, you will prepare a solution of approximately 0.1 M sodium hydroxide and standardize this solution using potassium hydrogen phthalate (KC8H5O4, often referred to as “KHP”; molar mass = 204.2 g/mol) as the primary standard, as you did previously in the CHEM-C 125 experiment Analysis of Acids and Bases by Titration. Please review the discussion about acid-base titration in the lab manual for that class.
Procedures
- You will perform this experiment in pairs. However, for the solution preparation and standardization part, if your lab partner is absent you should conduct this part of the experiment individually.
- Review the directions on using a pH meter in Using Laboratory Equipment before coming to lab.
- It is critical that
- All solutions are properly labeled.
- Volumes are measured accurately using volumetric glassware when preparing solutions. The exact volume for the pH measurement, however, does not matter. You will need to ensure that you have at least about 10 mL of solution to take good measurements such that the minimum liquid level on the pH probe is exceeded.
- You must label and turn in your solution of sodium hydroxide. In the next lab period, you will use this solution as a secondary standard} to perform acid-base titration experiments.
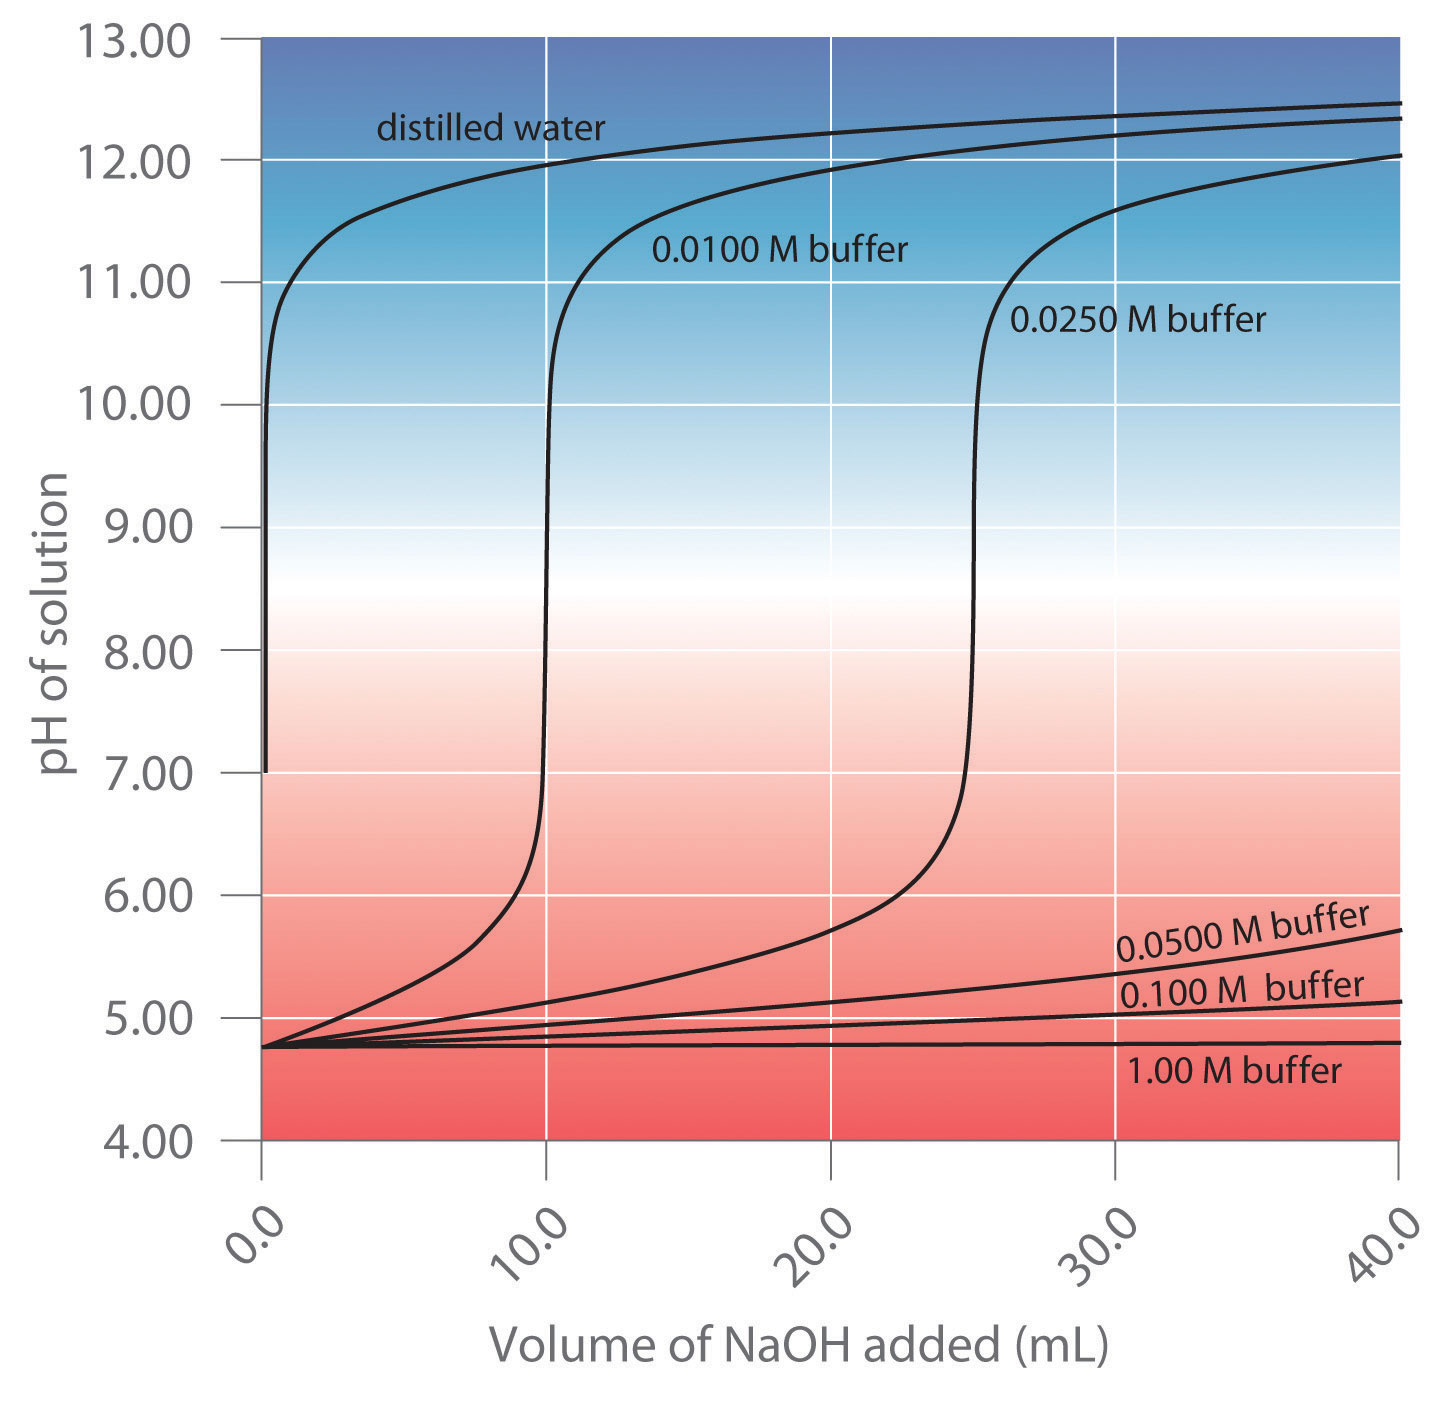
The Action of Buffers
- Turn on your device and open the Vernier Graphical Analysis app. Connect the pH probe following the directions in this manual. Calibrate the pH probe using pH 4, 7 and 10 buffers following the directions here.[3]
- Prepare a buffer solution by mixing 15.0 mL of 1.0 M acetic acid (CH3COOH) with 15.0 mL of 1.0 M sodium acetate (CH3COONa) in a graduated cylinder. Mix these solutions thoroughly and measure its pH in a test tube.
- Measure out 5 mL of this solution into each of three different test tubes.
- Mix into the three different test tubes the following:
- 5 mL deionized water
- 5 mL of 0.05 M sodium hydroxide
- 5 mL of 0.05 M hydrochloric acid.
Measure the pH of each of these solutions
- Repeat steps 3 and 4 using deionized water instead of the buffer solution you made in step 2.
Indicators
This part of the experiment will be done individually; each student will be assigned a different pH buffer.
As you may know different indicator have different colors depending on their pH. These are often summarized on charts like this:
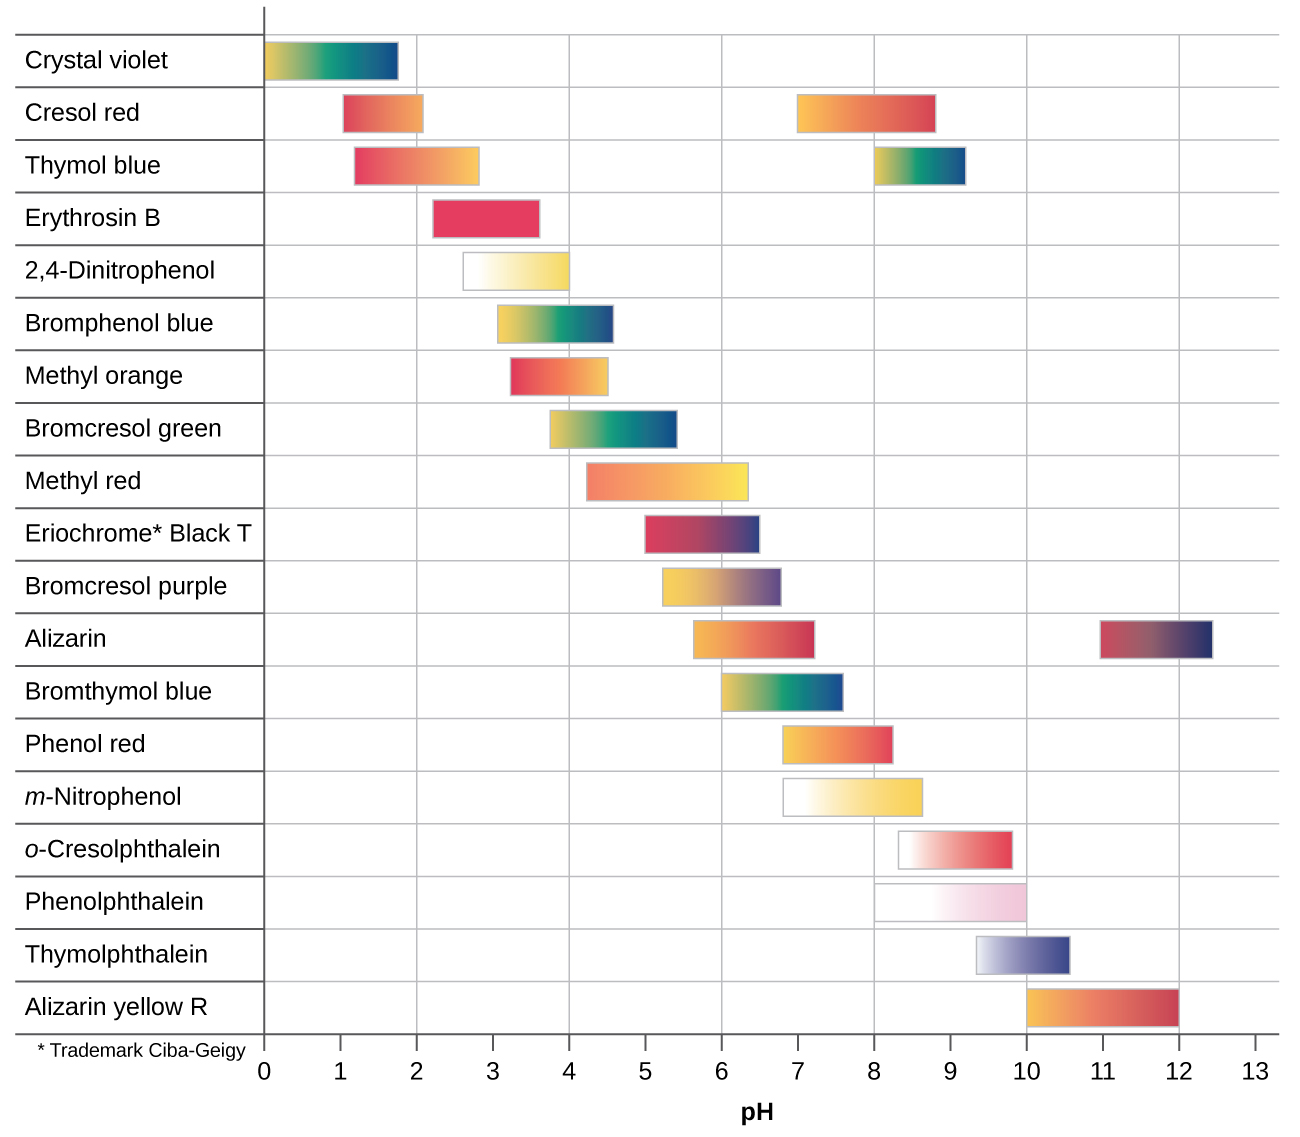
You will be assigned one of the buffers provided (pH 4, 7, 10) to study. The goal of this experiment is to use two different indicators from this list to identify the pH as best you can. You will be given the following indicator solutions:
- alizarin yellow
- bromothymol blue
- methyl orange
- methyl red
- phenolphthalein
- phenyl red
Add a small amount of your chosen indicator solutions into separate samples of your assigned buffer solution. Record the colors of each of these solutions.
Preparation of a Sodium Hydroxide Solution
In this part of the experiment, you will prepare using solid sodium hydroxide approximately 500 mL of 0.1 M standardized sodium hydroxide. To determine the pH, you will prepare a standard potassium hydrogen phthalate (KHP) solution as a primary reference.
- Calculate the mass of solid sodium hydroxide required to prepare 500 mL of 0.1 M sodium hydroxide solution.
- Prepare 500 mL solution in a beaker, dissolving approximately the amount of sodium hydroxide required into it. Be sure that the solution is properly stirred. Pour this solution into the plastic bottle provided. Label the plastic bottle with the label provided with the following information
- Your names/initials.
- The identity of the solution (including the approximate concentration).
- Today’s date.
- The hazard class (look up from an SDS sheet)
Standardization of Sodium Hydroxide
Following the directions in the Analysis of Acids and Bases by Titration experiment, prepare a sodium hydrogen phthalate (KHP) solution and use this to determine (accurately) the concentration of sodium hydroxide solution you prepared.
The bottle of sodium hydroxide you prepared should be placed in your drawer for use next week.
Waste Disposal
All waste from this experiment can be disposed of in the drain with plenty of water.
