
22 The Spectrochemical Series for Complex Ions
Purpose
To compare the energy splitting for different transition metal complex ions with different ligands.
Expected Learning Outcomes
- Measure the absorption spectra of complexes.
- Compare the color and absorption spectra due to ligand exchange.
Textbook Reference
Tro, Chemistry: Structures and Properties, 2nd Ed, Ch. 22.5
Theoretical Background
As you may know, in inorganic chemistry often we will have (particularly for transition metals) complex ions where the central ion is covalently bonded to a number of molecules or polyatomic ions with lone pairs. In this case, the central metal ion acts as a Lewis acid while the ligand molecules act as Lewis base molecules.
Many transition metal complex ions are colored; the colors depend on the identity of the metal ion and the ligand molecules. Some examples of these complexes are shown below:
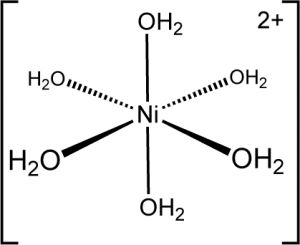
Different complex ions will have different arrangements of ligands around the metal ion. In many cases, such as the nickel(II) ions we will study in this experiment, the ligand molecules are arranged in an octahedral geometry about the central ion as shown above (with 90° angles about each ion).
Explaining Colors in the Spectrum
There are a number of different ways by which we can explain these. The simplest approach to do this – how we will handle this – is by using crystal field theory. To start off, we need to remind ourselves that there are five different d orbitals:
As you can imagine, if we consider each ligand molecule as a lone pair that would repel the electron density in the d orbitals at the positions L in the figure above, we see that L points directly at a lobe of the [latex]d_{x^2-y^2}[/latex] and [latex]d_{z^2}[/latex] orbitals (the eg orbitals). In contrast, the [latex]d_{yz}[/latex], [latex]d_{xz}[/latex] and [latex]d_{xy}[/latex] orbitals (the t2g orbitals) do not align directly with any of the ligand molecules. [1]
As a result, instead of all five d atomic orbitals being equal in energy, there is now energy splitting between them. As a result, the d electrons will be filled in these orbitals following the aufbau principle. Similarly, when photons with energy [latex]\Delta_{\mbox{oct}} = E_{\mbox{photon}} = h\nu = \frac{hc}{\lambda}[/latex] are incident on the compound, it absorbs this wavelength of light.
Furthermore, as explained previously in the Absorption Spectrum of Allura Red experiment, when a particular color is absorbed the compound would end up taking on its complementary color (the color opposite to the absorbed color in the color wheel).
Ligands and Energy Splitting: The Spectrochemical Series
As mentioned before, different ligands lead to different degrees of splitting. The degree of splitting is illustrated in the spectrochemical series, where we list the ligands in order of decreasing splitting ([latex]\Delta_{\mbox{oct}}[/latex]:
(strong field) CN– > [latex]NO_2^-[/latex] > ethylenediamine > NH3 > H2O > OH– > F– > Cl– > Br– > I– (weak field)
Procedures
You will study the complex ions of copper(II) (Cu2+) and cobalt(II) (Co2+) with the following ligands:
- water (H2O)
- hydroxide ions (OH–)
- ammonia (NH3)
- chloride (Cl–)
Preparing the Samples
- Following the directions in Using Laboratory Equipment, connect to the SpectroVis Plus and set the app to Absorbance vs. Wavelength (Full spectrum) mode. Calibrate the device using water as a blank.
- For each of the cations, prepare three cuvettes containing about 1 cm high of the aqueous solutions with cations (copper(II) nitrate and cobalt(II) nitrate).
Measuring the Absorption Spectra of the Samples
Complete each step from this part for each cation:
- Record the color and measure the absorption spectrum for your sample. Since this is in aqueous solution this would be the sample with water molecules as ligands.
- You have three cuvettes. Add the following dropwise to each of the cuvettes until any color change becomes consistent.
- 6 M sodium hydroxide or potassium hydroxide – this will yield the complex ion with OH– ligands.
- 12 M hydrochloric acid – this will yield the complex ion with Cl– ligands.
- 6 M ammonia – this will yield the complex ion with NH3 ligands.
- Record the color and measure the absorption spectrum of each of the samples above. Record the wavelength at the absorption maximum of the lowest energy (longest wavelength) peak. (this should be a peak; it should not be a flat shoulder. If you see that it likely indicates that you had precipitate).
- Save a copy of the spectrum file and an image of the spectrum obtained. Record in your notebook which line corresponds to which ligand.
- Restart the process by selecting New Experiment.
Be sure to share the data files with your lab partner before leaving the lab.
Waste Management
All waste from this experiment must be disposed of as hazardous waste in the side fume hood.
Acknowledgment
This experiment is a rewrite of a similar experiment from Bellevue College.
- The argument can be generalized to other coordination complex geometries; the main difference is that there are different amounts of repulsion for each type of orbital depending on the ligand configuration (and hence the energy level diagram changes). ↵
