
8 Purifying Water by Distillation
Purpose
To purify groundwater or surface water using distillation and evaluate its effects.
Expected Learning Outcomes
- Purify a substance using distillation and vacuum filtration
- Evaluate the purity using experimental data.
- Use a SpectroVis spectrophotometer to determine the concentration of a sample.
Introduction
Distillation
Distillation is the process in which a liquid is boiled and its vapor is re-condensed elsewhere to separate it from substances with a higher boiling point. When you vaporize a liquid, each component will have a different partial vapor pressure as determined by Raoult's Law
[latex]P_A = \chi_A P_A^\circ[/latex]
where [latex]P_A^\circ[/latex] is the vapor pressure of the pure liquid, and [latex]\chi_A[/latex] is the mole fraction.[1] The more volatile compound (lower boiling point) will have a higher vapor pressure for the pure liquid, thus the more volatile compound will make up a larger proportion of the molecules in the vapor phase.
Examples
The liquid condensate is then collected. Since this was condensed from the vapor phase, it would have the same composition as the vapor phase (and hence contain more of the more volatile component.
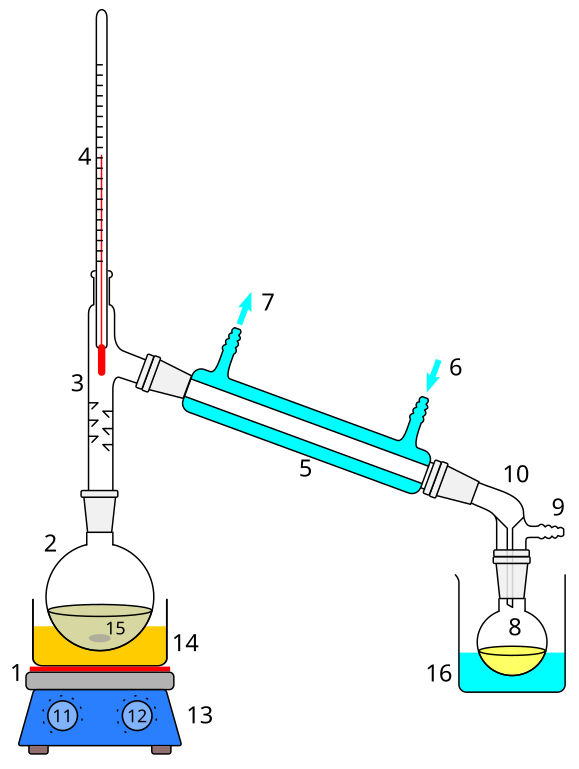
The technique requires a heat source, a vessel containing the mixture to be separated, a short vapor pathway to a cooled condenser and a receiver for collecting the condensed liquid. A typical laboratory distillation apparatus is shown on the following figure. The condensed liquid collected is referred to as the distillate.
This is a traditional approach used to purify many different chemicals, including how things with a high alcohol content like rum, vodka, and whiskey are created from beer/wine[2]. But the most commonly used distilled chemical in the chemistry lab is distilled water[3]. In this lab, we will learn how to distill water from a natural source and then evaluate the purity of our distilled water by using a standard test kit from fish stores.
Determining Concentration of Impurities
To see how well our distillation worked to remove the impurities from our natural water sample, we are going to use several methods to measure the identity and concentration of common impurities. First, we can use the conductivity meter we used in week 2 to measure the total dissolved solids in the sample before and after distillation. However, this doesn't tell us anything about the identity of the impurities, so for that we will need different tests. Fortunately, because of the pool and aquarium industry, there are a lot of very simple commercial resources available to measure the identity and concentration of solutes likely to contaminate water samples. Most of these resources are simple dip-stick tests where you dip a strip of paper that has been treated with proprietary reagents that cause the paper to change color in the presence of a specific chemical. The intensity of the color can then be compared to provided standards to estimate the concentration of that chemical in the sample. This is the way all of the test strips we will be working with work except for the phosphate test strip.
When you put the phosphate test strip into the water sample, instead of the test strip changing color, the water changes color and you compare the color of the water to provided standards to estimate the concentration of the phosphate in the water. However, instead of just eyeballing the concentration based on the provided color standards, we're going to use a more accurate method for estimating the concentration: measuring the absorbance of the sample and comparing it to standards of known concentration. I won't go into detail about how and why this works since that's the subject of next week's lab, but you will need to use a SpectroVis spectrophotometer to measure the absorbance of your samples the same way you did in week 2. I recommend reviewing the notes you took in your lab notebook about how to use the SpectroVis and re-reading the relevant part of the Week 2 - Significant Figures lab manual. You might also find it useful to watch this YouTube video demonstrating how to use a SpectroVis to determine the concentration of a sample by measuring the absorbances of known standards since that is exactly what you will be doing.
Experimental Procedure
Special Equipment/Supplies
- 100 mL round-bottomed flask
- Alcohol thermometer
- Condenser
- Fish water test strips
- 150 mL of natural water
- Conductivity meter
- Sodium phosphate standards (5.0 μM and 10.0 μM)
Filtration and Preliminary Observations
- You will be provided with a sample of water obtained from somewhere in the area to purify. Invert the bottle a few times to thoroughly mix the water sample, then measure out approximately 150 mL of this water. Record the location and appearance of the water.
- Following the directions in the back matter, set up and vacuum filter approximately 100 mL of water (use a transfer pipet and wet the filter with a few mLs of your natural water sample). Record the appearance and smell (being careful to waft the fumes to your nose rather than to smell the product directly) of the filtrate (the water that passed through the filter) and anything stuck on the filter.
- AFTER starting the distillation, follow the directions on the test kits/strips to determine and record the concentrations of different impurities (sulfate, nitrate, nitrite, carbonate, ammonia), hardness, and pH in the excess filtrate (~50 mL). You should also find the concentration of total dissolved solid (in ppm) using the conductivity meter (which you used in week 2) and the concentration of phosphate using the procedure specified below.
Distillation
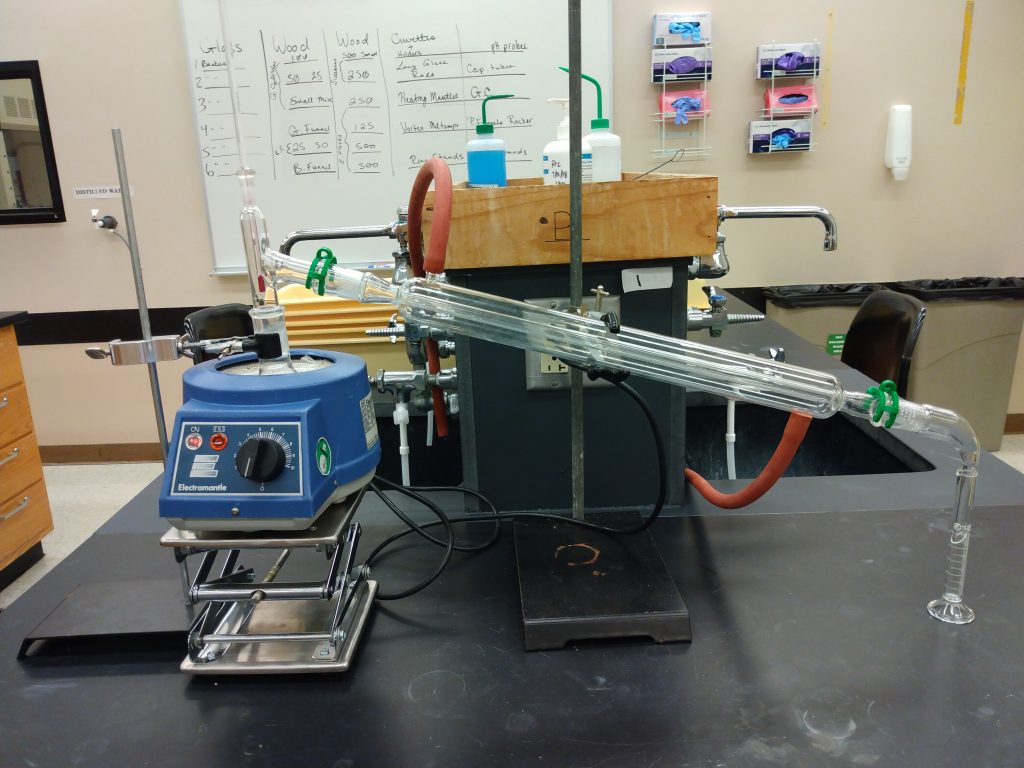
- Create a distillation apparatus as seen below.
- Note that this distillation apparatus is slightly different from the setup in the figure above:
- We are using a heating mantle (available from the back of the lab room) on a lab jack as our heating source.
- We will put green Keck clips at every joint except to the round-bottom flask (where it can get hot enough to melt plastic)
- Keck clips are directional, put the larger side of the clip on the larger part of the joint.
- Make sure the 3-prong clamp on the condenser has the 2 prongs underneath the condenser, is centered on the condenser, and that the base of the ring-stand is beneath the condenser.
- We will use a bent adapter in a 50 mL graduated cylinder as a receiving container (you can use a 25 mL graduated cylinder and occasionally transfer the liquid to an Erlenmeyer flask if your 50 mL graduated cylinder is too tall) instead of a vacuum adapter in a round-bottom flask.
- Remember to connect the rubber tubing connected to the lower end of the condenser to the water supply and place the other end of the rubber tubing connected to the upper end of the condenser in the sink (if you have trouble getting the rubber tube to stay in the sink, tape it down).
- Note that this distillation apparatus is slightly different from the setup in the figure above:
- Make a note of the temperature in the room according to your thermometer.
- Add 2 boiling chips to a 100 mL round-bottom flask and measure its mass (use a cork ring to keep the flask from rolling off the balance and breaking). Make a note of which balance you use for this step and be sure to use the same balance to weigh the round-bottom flask at the end of the distillation.
- Measure out approximately 50 mL of the filtered water into a graduated cylinder (record how much you measured out to the correct number of sig figs) and transfer it into the round-bottomed flask.
- Turn on the water supply and make sure that there is a continuous flow of water through the condenser, and that the outer jacket is almost completely filled with water. Check with your instructor to ensure that the distillation setup is assembled correctly before proceeding. Make note in your lab notebook about any changes your instructor has you make.
- Start by heating the flask at a setting of 8 on the Variac (if the Variac has a switch on the side, have this switch set to the bottom setting). Adjust the Variac setting every ~5 minutes by 0.5-1 until you have a drip rate of 2-3 mL per minute. Record the setting, temperature range, drip rate, and how much distillate you collected (and its appearance) during each 5-minute increment.
- To help keep track of the volume, you can use the rule of thumb that 20 drops = 1 mL, but at some point you will need a more precise measurement of the volume.
- Turn off the Variac and remove it from the round-bottom flask by lowering the lab jack when all of the water has been boiled out of the round-bottom flask.
- Note that when distilling organic compounds, it's important never to let the flask you're distilling boil dry as some organic compounds can slowly form peroxides over time, which can explode if too much heat is applied (which can only happen after all of the solvent has boiled away). Since we're distilling water, this isn't an issue for us.
Measuring Phosphate
Instead of following the directions on the packet for the phosphate test strips where you compare the intensity of the blue color created to a provided set of color standards and eyeball the phosphate concentration, we're going to measure the absorbance of our samples and compare it the absorbance of a set of standards the lab staff have made for you since this is how chemists usually measure concentration, as you will see next week. The standards you will be using are a 0 μM phosphate solution (distilled water), 5.0 μM phosphate solution, and 10.0 μM phosphate solution.
- Label 5 small test tubes with an appropriate name (e.g., 10.0 μM). (Put them in a test tube holder found under the sink when you're done.)
- Measure out 5.0 mL of each sample into the appropriate test tube. Start with your filtrate (pre-distillation), then rinse your 10 mL graduated cylinder thoroughly with distilled water, then measure out your standards in order of least to most concentrated (do NOT rinse your graduated cylinder between standards), then rinse it out thoroughly with distilled water and let it air dry for a little while before measuring out your distilled natural water sample (move on to the next step while waiting).
- Put 1 test strip in each test tube, seal the top with parafilm (ask your instructor if you're not sure how to do this), invert to mix for 10 seconds. Let the test tube sit (with the test strip in it) for 2 minutes, then take out the test strip.
- Observe and describe the color and appearance of each solution in your lab notebook. Estimate the concentration of each solution in ppb using color standards provided on the test kit bottle by placing the the bottom of the tube on the white circles to the right of the blue circles and looking through the top of the test tube.
- Following the directions in Using Laboratory Equipment, measure the absorption spectrum of the 10.0 μM phosphate solution (using house distilled water to calibrate the spectrophotometer, NOT your 0 μM phosphate solution).
- It is important to ensure that the clear ends of the cuvette are facing the sides with the white light bulb and the white arrow (not the other way around), and that those ends are cleaned with a Kimwipe and kept free of fingerprints while handling. Always hold the cuvettes on the glazed faces (or if all sides are clear, on the sides that do not face the white light bulb or the arrow) and from the top part of the cuvette (the part that sticks up above the cuvette holder on the SpectroVis).
- Determine the best wavelength (i.e. the wavelength that gives the highest absorbance) at which you should measure the absorption values for determining the concentration and record this wavelength in your notebook. Note that this wavelength will be slightly different for each group due to random error from the spectrophotometer itself.
- Save the absorption spectrum by selecting from the menu for the file name at the top left hand corner and enter “Export”. Save an image of the graph.
- Select “New Experiment” from the file name at the top left hand corner of your screen, and then select Absorbance vs Concentration (Beer’s Law).
- Enter the wavelength you selected in step 6 above.
- Measure the absorbance (click “measure”, then “keep”) with the SpectroVis, then enter the concentration of the 5 phosphate standards in molarity instead of micromolarity (1 μM = 10-6 M) (do NOT enter the concentration in scientific notation, use the full decimal form – e.g. 0.0000025 instead of 2.5 x 10⁻⁶).
- Check that the graph is linear (i.e., make sure all the data points are approximately in line with each other). If your graph looks curved, or the data points don’t line up, double check you entered your concentrations correctly (e.g., maybe you put too many or too few 0's for one of your standards).
- On Vernier Spectral Analysis, click on the Graph tool icon on the bottom left of the graph and select Apply curve fit. Select the linear function and apply that fit. This will show the parameters for the best fit line. Record the information in the box that pops up in your lab notebook (you might need to scroll down to see all the information in the box).
- In preparation for exporting an image of the plot, move the box containing the curve fit data somewhere that doesn’t block the data points or the best-fit-line on your graph.
- Export the plot as you did in step 7.
- If you can’t get the function to work in the Vernier Spectral Analysis software, you can also plot the absorbance vs the concentration using Excel or Google Sheets and create the graph and the best-fit-line that way. See your instructor if you need help.
- Measure the absorbance of your pre-distillation and post-distillation samples using the same wavelength as you used for the standards and write down the absorbances in your lab notebook.
Characterizing the Product
- Describe the appearance and smell (wafting again) of the distillate.
- Measure the total volume of the distillate using a 50 mL graduated cylinder to the correct number of sig figs.
- Use the conductivity meter and the provided test strips to determine and record the concentrations of different impurities (total dissolved solids, sulfate, nitrate, nitrite, carbonate, ammonia), hardness, and pH in the distillate. Use the procedure above to determine the amount of phosphate present in the distillate as well.
- See your lab notebook and the lab manual from the Week 2 Significant Figures lab for detailed instructions on how to use the conductivity meter.
- After letting it cool to room temperature, describe the appearance and smell (wafting again) of the residue in the round-bottomed flask and measure its mass using the exact same balance you used to measure its mass before distilling.
Waste
The waste from this experiment can be washed down the drain with plenty of water.
- The number of moles of A in the mixture divided by the total number of moles of particles in the mixture. ↵
- Technically, spirits like rum, vodka and whiskey aren't distilled from beer or wine, they're distilled from a beer/wine-like substance specially made to create the liquor. ↵
- The water we use is actually deionized, not distilled, which creates essentially the same product (pure water) through a completely different process. ↵
