
6 Research Project: Pigments in Plants (UV-vis version)
Purpose
To determine the composition of pigments in different types of plants.
Expected Learning Outcomes
- Extract, separate, and characterize compounds from a mixture.
- Describe the purpose of analytical separations.
- Conduct thin-layer chromatography (TLC), column chromatography and ultra violet to visible spectroscopy (UV-vis).
Reading Assignment
The focus of this experiment is on liquid phase extractions/separations. While separations are mentioned briefly in Tro, Chemistry – Structures and Properties, 2nd Ed, Ch. 1.2, the following readings from Nichols, L., Organic Chemistry Lab Techniques will help you understand this experiment:
In addition, we will introduce UV-vis spectroscopy (spectroscopy in the ultra violet through visible wavelengths of light). Please watch the following video to get a basic understanding of what UV-vis spectroscopy is and how it is used (note that while the terms spectroscopy and spectrophotometry are technically different, for the purposes of this class, you can consider them to be synonymous):
About This Project
So far, most of the experiments we have done have definite, well known answers, and we’ve been doing experiments that either (a) confirm what you’ve learnt or (b) illustrate concepts from the lecture course. We will continue to do those experiments, not least because the combination will support your learning and help you develop laboratory skills.
However, in real life, we often need to study problems with no well-defined solution or problem. We are dealing with unknown problems.
As you may know, the color of a plant is mainly determined by the different pigments in the plant. While the most famous plant pigment is chlorophyll (the pigment mainly responsible for photosynthesis and for making most plants green), plants have a variety of other pigments that have their own purposes and colors.[1] Each plant has its own unique mixture of pigments, and as different plants have different colors, we want to know how the pigments vary from plant to plant – what pigments are there, and how much?
Specifically, we’re going to try to determine if different plants that have the same color use the same pigments or different pigments to achieve the same color. We will do this using chromatography and spectroscopy to separate and identify the pigments in several different plant samples as explained below. While each group will only analyze a single plant sample, all the groups will share their data with each other so that you can compare the pigments present in different plants and “try to determine if different plants that have the same color use the same pigments or different pigments to achieve the same color”. This means that the experiment is being done by the entire class, not just by your group. Without the data from other groups, you cannot succeed in completing this project. This means that the success of the other groups is just as important to your ability to complete this project as your own success is. While this doesn’t impact what you will do during the lab, it has major implications for how to complete the short report and the formal report for this project since part of the formal report is explaining what everyone did and found, not just what you did and found. You cannot explain what happened in this experiment and whether different plants that have the same color use the same pigments or different pigments to achieve the same color if you only look at the pigments in a single sample.
Chemical Principles
Mixtures
Most of the substances we find in nature (wood, air, petroleum, etc.) are not pure but are instead more or less complex mixtures. Some of these mixtures require little or no modification before being put to practical use, but many of them must be at least partially separated into their components before they can be used to the best advantage.
Examples
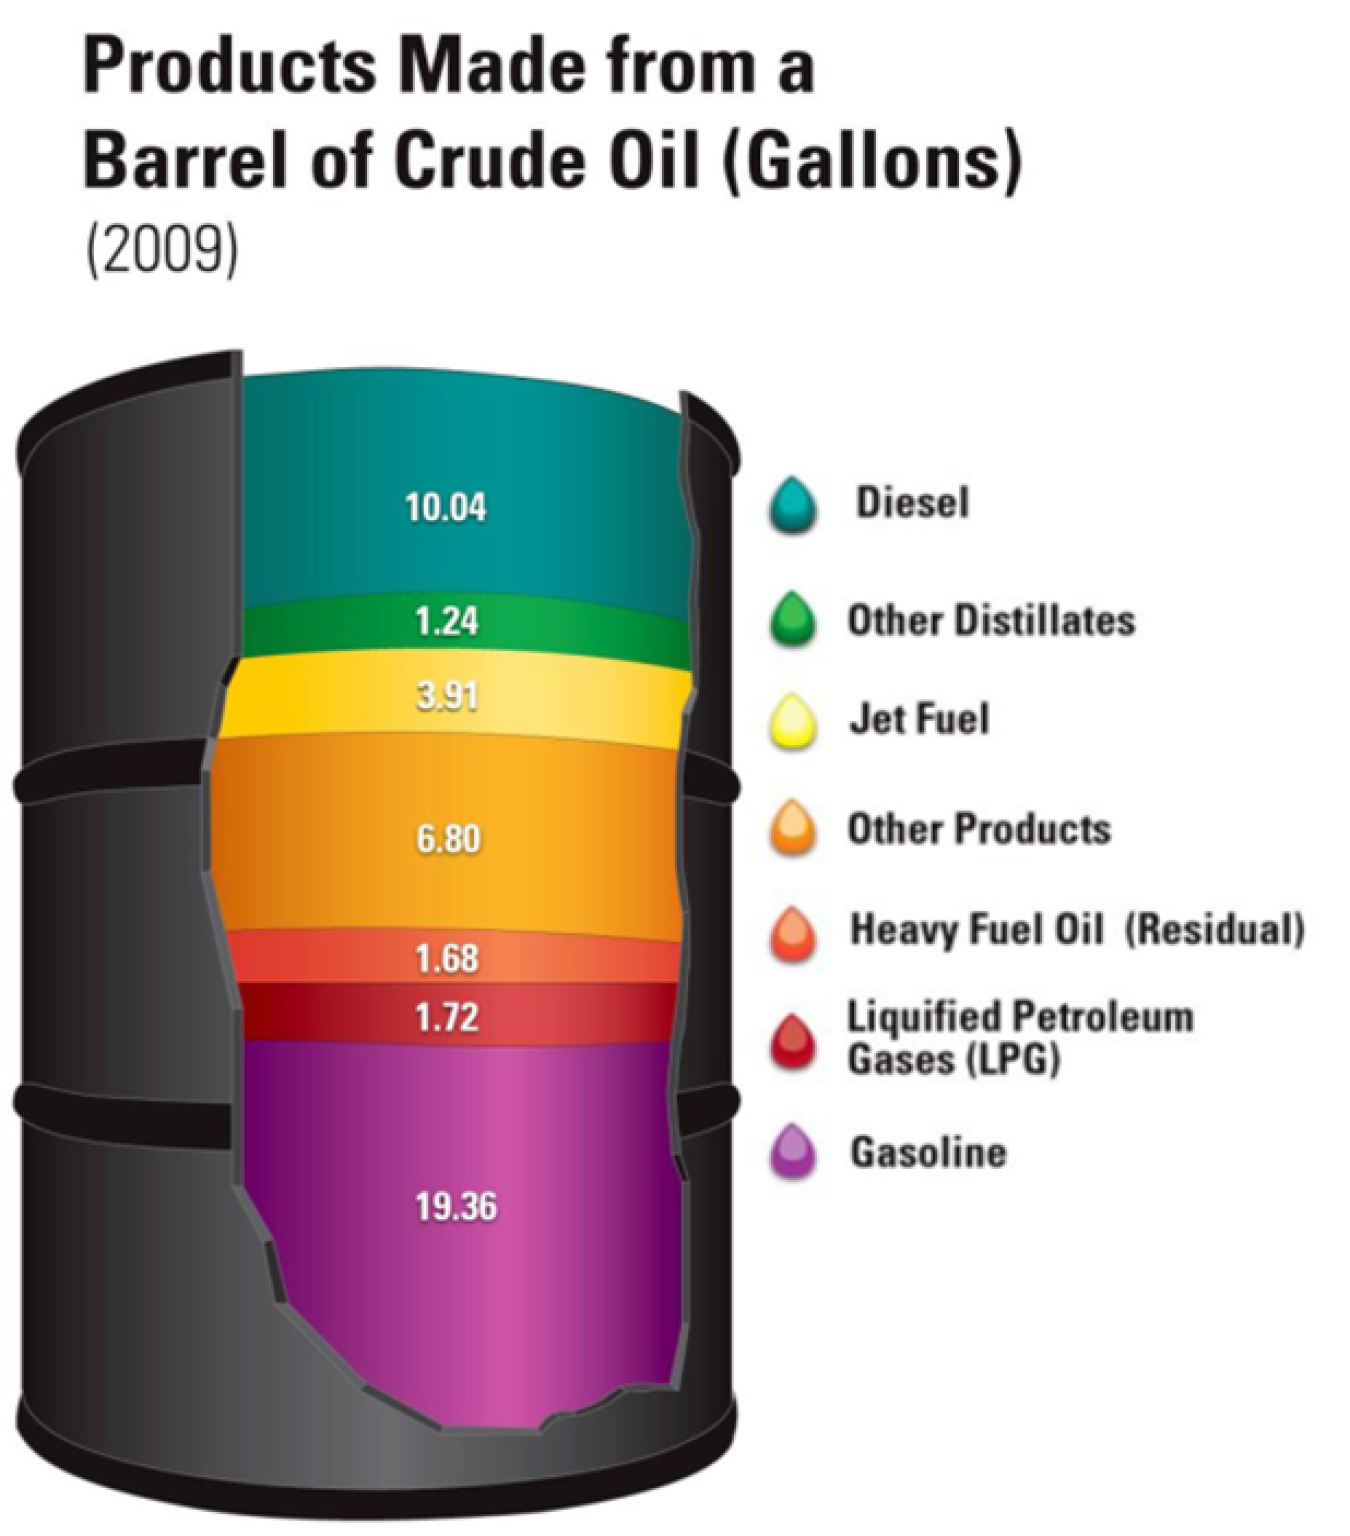
- Crude oil is a mix of different hydrocarbons (compounds formed from carbon and hydrogen) that is separated into different components as shown below.
- Hard water is “softened” by separating out dissolved calcium carbonate (limescale) from water.
There are a number of chemical and physical processes used to separate mixtures but two of the most important for scientists today are the closely related techniques of extraction and chromatography.
Separation Method 1: Extraction
Extraction is the process of separating different substances by their differing solubilities in the same solvent (or solvent mixture).
Examples
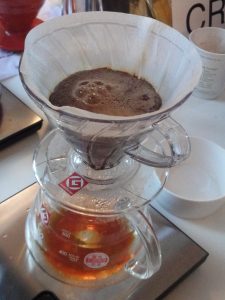
When coffee is made using either a percolator or a drip-type coffee-maker, the hot water acts as a solvent to dissolve caffeine, tannic acid, and a large number of other chemical compounds, leaving the coffee grounds undissolved. This process is an extraction because of the differing solubilities of different substances: the caffeine and tannic acid are much more soluble in hot water than other components of the coffee grounds are (cellulose, for example).
Coffee-making illustrates the main requirements for a successful extraction:
- The mixture to be separated must be thoroughly mixed with the solvent (for example, by the “percolating” action).
- Other components must not dissolve in the solvent.
For a successful extraction we must find a solvent (or solvent mixture) that does a good job of dissolving the components we want but leaves undissolved components we don’t want. Since the solubility of most solids and liquids goes up with increasing temperature we can sometimes get the best results by using a hot solvent for the extraction. This is true for instance for most of the substances we want in our coffee, so we always start with very hot water (even if we are planning to end up with iced coffee). Other ways include using different solvents.
Separation Method 2: Chromatography
Chromatography is another general technique for separating compounds that has several points in common with extraction; for example, differing solubilities of different substances play a part in both techniques. Chromatography differs from extraction in that this always involves the movement of one phase (the “mobile phase”) past a non-moving phase (the “stationary phase”) to bring about the separation. Conditions are set up so that different components of the mixture are carried along with the mobile phase at different speeds as they pass through the stationary phase.
The ultimate point of any type of chromatography is to separate compounds. Students often think that what makes for good chromatography is when the sample travels far and/or quickly along the stationary phase. This is incorrect. The speed/distance compounds travel tell you nothing about how successful the chromatography was. To determine the success you have to look at how well your compounds were separated. If everything travels the same distance or at the same rate, then your chromatography was unsuccessful even if they traveled all the way through the stationary phase.
Examples
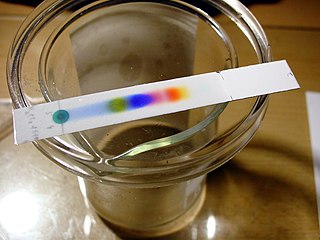
Different inks can be separated into different compounds/pigments using various forms of chromatography.
The big idea here is that there are two substances in which a substance can be dissolved:
- The stationary phase is a substance that is fixed along the entire structure where chromatography is conducted.
- The mobile phase which is typically a liquid or gas, and can move through the stationary phase.
Depending on the nature of the two phases and the substance concerned, there are varying ratios of solubility between the mobile phase and the stationary phase for different compounds. When a substance is more soluble in the mobile phase, it would tend to move along with the solvent front (the point where pure solvent has flowed to). Conversely, when a substance is more soluble in the stationary phase, then it would tend to stay on the stationary phase and not move.
Examples
For the inks on the TLC plate above, the extent to which the sample is soluble in the ethanol:water mixture relative to the silica (stationary phase, surface on the TLC plate) determines how far it migrates. Relatively speaking, the yellow ink is more soluble in ethanol:water (relative to silica) compared to the black ink.
While TLC is useful for quickly analyzing a sample and determining what compounds are present in that sample, it is very difficult to remove compounds from a TLC plate, thus it is not generally used to purify compounds. If you want to be able to collect the components of a mixture after separating them, column chromatography is more useful. In this technique, you place the stationary phase (for this experiment, silica gel) in a column (which is constructed using a glass, disposable Pasteur pipet). The sample is then loaded, and mobile phase is loaded to drive the sample until it elutes out of the bottom of the column. Each component is therefore isolated from each other and can be studied using absorption spectroscopy. This is the main method used to purify, among other things, proteins for biochemical experiments.

Absorption Spectrum
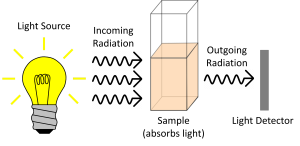
The basic principle of spectroscopy is that you shine light on a sample, that sample absorbs some of the light, then a detector determines how much light of each wavelength was NOT absorbed by the sample (i.e. how much light was transmitted through the sample).
Depending on the chemical structure of the molecule, different molecules can absorb light of different wavelengths. The color of the compound is the complementary color of the color of light absorbed – as seen in the color wheel, where the color observed is on the opposite side of the wheel:

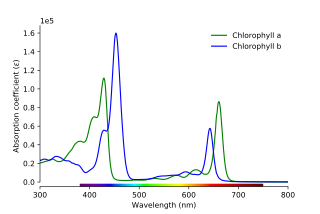
In turn, each color of light corresponds to a different frequency/wavelength of light. The absorbance of light at different wavelengths can be plotted in an absorption spectrum, which can be used to help characterize a compound:
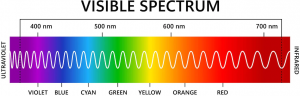
The visible spectrum is as follows:
The absorbance of a solution can be measured using a spectrophotometer; details on how to use this is explained in Using Laboratory Equipment.
Spectroscopy can also be used to quantify how much of a compound is in a sample based on how much it absorbs at a specific wavelength. Since each compound has a different absorption spectrum, we can measure how much light a mole of molecules of a specific compound absorbs at a specific wavelength (this is known as the compounds molar absorptivity). We can use this value and the absorbance of our sample to estimate how much of that compound is present in our sample using Beer’s Law, which states that the absorbance of a sample goes up linearly with increasing concentration of the compound. We can write this out as an equation in the following way:
A = ε * C * l
where A = absorbance (a unitless number) at the desired wavelength (as measured by the spectrometer), ε = molar absorptivity at the desired wavelength (in units of L/(mol*cm)) (for this experiment, you will be given any molar absorptivity values you need), and l = the path length (i.e. the width of the cuvette, which is to say how far the light has to travel through the sample and thus has the possibility of hitting a sample molecule and being absorbed), which is almost always 1 cm (unless you are told differently, you can assume that the path length is 1 cm). You will learn more about spectroscopy and how to use it to quantify compounds in a few weeks during Experiment 9: Absorption Spectrum of Allura Red.
Procedure
- This is a multi-week experiment. Your notebook will be graded when you finish the UV-vis part of the experiment.
- It will be conducted in pairs.
- Before conducting this experiment, please review the directions on gravity filtration and using the SpectroVis Plus in Using Laboratory Equipment.
- As this is a research project and particularly since it’s the first time we’ve tried this, the procedure is prone to revisions and change.
Week 1: Extraction and Thin-Layer Chromatography
This week, you will
- extract the pigments using organic solvents and water.
- analyze the extracted pigments using TLC.
Required Special Materials and Chemicals
- Mortar and pestle
- plant suspension (50 g)
- Sodium sulfate (5 g)
- saturated sodium chloride solution (10 mL – use from provided bottle)
- 1:1 ethyl acetate:cyclohexane (50 mL)
- ethyl acetate (5 mL)
- cyclohexane (5 mL)
- TLC plates (2)
- 110 mm diameter filter paper (3)
- forceps (1)
Extraction
- Weigh out 50.0 g of your assigned plant suspension (made by blending the plant matter with a small amount of distilled water in a household blender) in a 100 mL beaker (the plant suspension can be found in the ice box). Record the species and mass to the nearest 0.001 g, as well as a description of the suspension.
- Vacuum filter the suspension. Observe what the liquid in the beaker and the solid on top of the filter looks like.
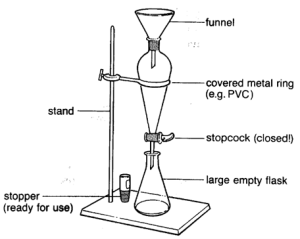
- Setup a 125 mL separatory funnel in a ring stand as shown in the figure above.
- Make sure you have a 250 mL beaker (don’t use a 250 mL Erlenmeyer flask as you will need it for a later step) underneath it in case it leaks when you add any liquid and that the bottom of the separatory funnel is below the top of the beaker.
- Check to make sure that there is a black rubber O-ring BETWEEN the nut on the stopcock and the white Teflon washer that presses up against the glass of the separatory funnel (if the O-ring is missing, the separatory funnel will leak, if it is touching the glass of the separatory funnel, it will disintegrate over time).
- Also make sure the nut on the stopcock of the separatory funnel is tight, but not so tight that it is difficult to open and close the stopcock.
- Add 2-3 mL of 1:1 ethyl acetate:cyclohexane (found in the ice box) to the separatory funnel to make sure it doesn’t leak.
- Make sure the stopcock is closed, meaning the handle of the stopcock should be perpendicular to the axis of the separatory funnel – this means that when the separatory funnel is in the ring stand, if the handle is parallel to the ground, then it is closed.
- Add the stopper to the funnel and invert it to make sure the ethyl acetate:cyclohexane doesn’t leak out the top.
- Keep your hand on the stopper to prevent it from falling out, then check your glove to make sure no liquid got on it.
- Note that a separatory funnel should only be capped when you are inverting it. When it is just sitting in the ring stand, the stopper should NOT be in funnel. This is because it is possible for gas to build up in a separatory funnel, which will increase the pressure inside the funnel if the stopper is in it. This could cause the stopper to get blown off the separatory funnel and fall to the ground and break.
- Gravity filter the liquid from step 2 into the 125 mL separatory funnel and place it in the ring clamp on the ring stand (there is no need to use fluted filter paper in this step, but you’re welcome to if you want to).
- While waiting for the gravity filtration to finish, scrape the remaining solids from the vegetable suspension in the Buchner funnel into a mortar (found in the ice box) and rinse the funnel with ~15 mL of cold 1:1 ethyl acetate:cyclohexane into the same mortar.
- Grind this mixture for 3–5 minutes in the fume hood.
- If very little liquid is visible in the mortar, add another 5-10 mL and grind for another ~30 seconds to mix it. The exact amount of liquid isn’t important, but there should be enough so that you can see a significant puddle of liquid.
- Filter the solution using gravity filtration, into the separatory funnel.
- Instead of using the folding for the filter paper described in the appendix, we’re going to use a piece of fluted filter paper (see here for a demonstration of how to fold filter paper so that it is fluted).
- Rinse out the mortar with another 15 mL of cold 1:1 ethyl acetate:cyclohexane and use this to rinse the solids in the fluted filter paper.
- Once the gravity filtration funnel stops dripping, extract the pigments from the aqueous (water) layer into the organic (ethyl acetate/cyclohexane) layer:
- Cap the separatory funnel and invert it as demonstrated in class and in this video (watch from 5:44-6:29; you can ignore what she says about acids and bases, that part isn’t relevant to us). Make sure you have your palm/finger over the stopper so that it doesn’t fall out.
- IMMEDIATELY open the stopcock to vent the separatory funnel (this is especially important since cyclohexane is highly volatile and vaporizes very easily). To open the stopcock, turn it so that it is parallel to the axis of the funnel. MAKE SURE THAT THE OPENING IS POINTED AWAY FROM OTHER PEOPLE as a small amount of liquid might spray out.
- Close the stopcock, invert again, and vent again. Keep inverting and venting until you stop hearing a hiss of escaping gases when you open the stopcock, then you can shake the funnel vigorously for 30-60 seconds between venting. Shake and vent multiple times until you are satisfied that the 2 layers have been thoroughly mixed.
- Place the separatory funnel back in the ring stand (make sure the stopcock is closed), remove the stopper and wait a minute or two until the organic (top) and aqueous (bottom) layers separate (make note of the color of each layer).
- Not only will removing the stopper keep you safer, but if you don’t remove it, no liquid will come out in the next step and it will be much more difficult to remove the stopper so that you can continue.
- If you don’t see any separation of layers, continue to step 11.6 without draining anything.
- Open the stopcock and drain the lower layer into a 250 mL beaker (label beaker as “aqueous layer” using a piece of labeling tape). Observe what the aqueous layer looks like.
- Open the stopcock all the way until the line that should be visible between the organic and aqueous layers is ~1 – 0.5 cm from the bottom of the funnel.
- Let the funnel sit for a few minutes to let any water stuck to the sides of the separatory funnel slide down to the bottom.
- Open the stopcock just enough so that liquid starts slowly draining again.
- Do your best to close the stopcock when the separating line between the layers is in the stopcock itself.
- If you accidentally allow some of the organic layer to drain out of the separatory funnel at this point, you will need to add the water layer back to the separatory funnel and repeat steps 11.4 and 11.5.
- Add 10 mL of saturated NaCl solution to the separatory funnel.
- The NaCl solution (brine) will help remove residual water that’s dissolved in the organic layer.
- Repeat steps 11.1-11.5, shaking for another minute (you can use the same “aqueous layer” beaker you used previously).
- Pour the organic layer that’s still in the separatory funnel out of the top of the separatory funnel into a 250 mL Erlenmeyer flask. If your organic layer is cloudy in the separatory funnel, do another gravity filtration of the organic layer into the 250 mL Erlenmeyer flask instead of pouring it directly into the flask.
- Do NOT drain the organic layer out of the bottom of the separatory funnel as that part of the funnel is contaminated with a small amount of the aqueous layer that we just so laboriously removed from the organic layer.
- Dry the organic layer with solid sodium sulfate (Na2SO4).
- Add a scoopful of sodium sulfate to the organic layer and swirl.
- If all of the sodium sulfate clumps up and largely sticks to the bottom of the flask, repeat step 12.1 with a smaller scoopful of sodium sulfate as many times as needed for the newly added solid to not clump up or stick to the bottom of the flask.
- Once the organic layer is fully dry (i.e. once you have added sufficient sodium sulfate), let the sodium sulfate settle to the bottom of the flask for a few minutes, then slowly decant the organic layer into a 50 mL beaker labeled with your initials, the date, and your sample identity in ethyl acetate/cyclohexane (use the provided label, weigh it after labeling it) such that no solid is transferred into the beaker and the solution is completely clear (not cloudy).
- If you are unable to decant the liquid successfully, gravity filter the liquid into the beaker instead (using a new piece of fluted filter paper).
- Spot and run two TLC plates with your dry organic solution (see below for details).
- Store the beaker (do NOT cover it) in the tub in the fume hood to let the solvent evaporate. Once the solvent has evaporated, the lab staff will move your beakers to the lab refrigerator to minimize any degradation of your sample. We will redissolve this residue next week.
- The aqueous layers may be disposed of down the drain with lots of water.
Thin Layer Chromatography
Create the developing chambers:
- Place a 110 mm diameter filter paper into a 400 mL beaker such that it is pressed up against the side of the beaker and touching the bottom of the beaker (you will need to fold the filter paper over a bit to create a flat bottom in order to get it to fit into the beaker). You will need 2 beakers, 1 for cyclohexane and 1 for ethyl acetate (make sure you label each beaker with your initials and the eluent you’re using with tape so you don’t forget which beaker contains which eluent).
- Create a lid for each beaker out of aluminum foil by covering the top of the beaker with a square of aluminum foil and shaping it to the top of the beaker to seal it as tightly as possible.
- When you are done with your aluminum foil lid at the end of the day, keep it in your drawer to reuse in the future.
- Add ~5 mL of cyclohexane to one beaker and ~5 mL of ethyl acetate to the other beaker and IMMEDIATELY cover the top of the beaker with the aluminum foil lid (seal as tightly as possible).
- If you use a transfer pipet with cyclohexane or ethyl acetate, draw up and expel the eluent in your transfer pipet several times before transferring it to the beaker so that the eluent won’t drip out of the pipet as much.
- Always hold pipets up and down (perpendicular to the floor), never sideways (parallel to the floor) as holding it sideways will cause the liquid to spill out.
- Gently swirl the beaker so that the eluent completely wets the filter paper (this will ensure that the atmosphere in the developing chamber is saturated with the eluent vapor, which helps ensure reproducible results).
- At this point, there should be a layer of eluent in the bottom of the beaker that’s ~0.5 cm thick. If it is significantly less than this, add a little more eluent using a transfer pipet.
Spot your TLC plates with your samples:
- Take a TLC plate from the box (there is sometimes a clear plastic covering on the top of each stack of TLC plates, this isn’t a TLC plate; TLC plates are clear shiny plastic on one side and matte white silica gel, which looks a lot like plaster, on the other side).
- Never touch the side of the TLC plate that has the silica gel with gloves. It can damage the silica gel and make the TLC plate unusable. Only touch the back (the plastic side) or the sides of the TLC plate.
- Never bend a TLC plate as this will cause the silica gel to flake off and make the TLC plate unusable.
- Using a NON-MECHANICAL PENCIL (the ink in pens will dissolve in organic solvents, and mechanical pencils will scratch off the silica gel), label the top of each of your TLC plates with your initials, the date and the eluent you will use to develop that plate (meaning one TLC plate should be labeled as cyclohexane and the other one as ethyl acetate).
- Non-mechanical pencils are available on the instructors desk at the front of the lab.
- Make 2 small horizontal lines 1 cm from the bottom of the TLC plate on each edge of the TLC plate.
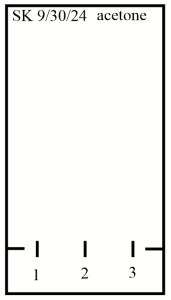
- Make 3 small (~1 mm) vertical tic marks 1 cm from the bottom of the TLC plate and ~0.5 cm away from the sides of the TLC plate and each other and label these tic marks “1”, “2”, and “3” (see figure below, but replace “SK” with your initials, “9/30/24” with today’s date, and “acetone” with whichever eluent you will run that particular TLC plate in).
- Dip a capillary tube into your dried organic solution. Capillary action will automatically suck up a small amount of the solution into the capillary tube as soon as the tip of the capillary tube hits the surface of the liquid.
- Don’t put your finger over the top opening of the capillary tube, doing so will prevent the liquid from going in and out of the tube.
- Lightly press the tip of the capillary tube onto each tic mark on the TLC plate until you see a dark spot appear. This dark spot is the liquid being pulled out of the capillary tube and onto the TLC plate. The longer you hold the capillary tube on the TLC plate, the bigger this spot will get. You want the spot to be ~1 mm in diameter (if your tic mark is ~1 mm, you can use your tic mark to determine when you can lift up on the capillary tube). Always err on the side of adding too little since you can always add more.
- You can usually make 2-3 spots from a single dip into your organic solution, but if you’re concerned you won’t have enough solution left in your capillary tube to make your next spot (keep an eye on where the solvent level is in your capillary tube before and after making each spot), just dip the capillary tube back into your organic layer.
- After the organic solvent has evaporated from the spots on your TLC plate (when the spot is no longer as dark; this should only take a few seconds), create a 2nd spot of the same size on top of the spots in the “2” and “3” lane. This is known as double-spotting and is done if you’re concerned that adding a single spot won’t add enough of the compounds of desire to see after running.
- Add a 3rd spot to the “3” lane after the organic solvent has evaporated again. This means that you should now have 3 lanes, each with a single dot over the tic mark. The “1” lane is single-spotted, the “2” lane is double-spotted, and the “3” lane is triple-spotted. This way it is more likely that one of the lanes will have the right amount of the mixture to be able to see each compound as a distinct spot.
- Repeat this process of creating a single, double, and triple spot on the 2nd TLC plate.
Run your TLC plate:
- Place your prepared TLC plate into the appropriate developing chamber such that the bottom of the TLC plate is in the solvent and the top of the TLC plate is resting against the side of the chamber at a ~45-degree angle and immediately replace the aluminum foil lid on top of the beaker (seal as tightly as possible).
- Make sure that the TLC plate is oriented such that you can easily watch the solvent travel up the plate (places with solvent will be darker).
- Make sure the solvent level is well below where you spotted your compounds, otherwise they can dissolve into the solvent. If this happens, you will need to make a new eluent chamber and a new TLC plate.
- Let the TLC plate run until the solvent gets ~1 cm from the top of the plate or for 10 minutes, whichever comes first.
- I’ve found that 10 minutes usually comes first.
- During these 10 minutes, you should be doing something productive, such as cleaning up, so make sure you pay close attention to each TLC plate and exactly when each plate started running so that you know when to stop each plate.
- Using a pair of forceps, grab the top of the TLC plate and remove it from the developing chamber.
- IMMEDIATELY draw a line showing where the solvent made it on the TLC plate.
- The solvent will start evaporating immediately, so the longer you wait to draw this line, the less accurate your results will be.
- The solvent might “smile”, meaning that the solvent closer to the edges ran slightly faster than the solvent in the middle. If this happens, the line you draw should reflect this.
- Once all of the solvent has evaporated from your TLC plate (i.e., it’s no longer dark anywhere), make a sketch of the TLC plate in your lab notebook (including a ruler) and take a picture of the TLC plate under ambient light (including a ruler) and under UV-light. (If you don’t let all the solvent evaporate from the TLC plate before taking the picture, it will be much harder to see the spots from the pigments and thus much harder to interpret and use the data from your TLC plates for your short report and formal report.)
- Colored compounds (such as the pigments we’re interested in) will show up under ambient light, but any compound that absorbs UV-light, regardless of whether they are colored or not, will show up as a dark spot when the TLC plate is illuminated with UV light.
- SAFETY NOTE: UV light can damage DNA, so always shine the light down, never up and avoid shining it directly onto your skin or into your eyes. You should also minimize how much UV light gets reflected onto your bare skin and eyes.
- We have 2 different UV lights, both work just fine for this, but the way you turn them on and off is very different. Get your instructor when you need to do this and they will show you how to use them.
Week 2: Column Chromatography, More TLC, and Visible Spectroscopy
This week, you will
- separate the pigments using microscale column chromatography.
- measure the visible absorption spectrum of each of the pigments.
Required Special Materials and Chemicals
- ethyl acetate (15 mL)
- cyclohexane (15 mL)
- silica gel (about 1-2 cm3)
- sand (a pinch)
- 1:1 ethyl acetate:cyclohexane (5 mL)
- TLC plates (1)
- 110 mm diameter filter paper (3)
- forceps (1)
- screw cap vials (3)
Column Chromatography
We will now separate out the different pigments in the pigment sample you extracted above, to isolate different pigments and characterize their absorption spectra.
- Once you start the elution process, it cannot be stopped. You must go to completion. Be sure to read all directions for this part before proceeding. Everything must be staged so that the process can occur seamlessly.
- One of the most important rules is that columns must not be allowed to go dry. A continual flow of solvent is therefore necessary to ensure that the resin remains wet and intact.
- As glass test tubes are fragile, be sure to handle these carefully.
- Prepare a silica column:
- Get a VERY SMALL (as small as possible) piece of a cotton ball put it into the top of the 5″ (short) Pasteur pipet
- Gently push the cotton plug to the bottom of the pipet with a 2nd, longer (9″) pipet.
- The point of the cotton plug is just to prevent the silica from falling out of the pipet, so don’t use too much cotton and don’t pack the cotton down too tightly. You want it to be relatively loose so liquid can get through but solid cannot.
- Scoop silica gel carefully into the column using a weigh paper funnel and make sure the column is collapsed so the powder falls to the bottom. Fill the pipet until it is about 2/3 full.
- Gently tap the side of the pipet for one minute to pack the silica.
- Add 0.5 cm of sand to the top of the pipet.
- Place the pipet column in a pipet clamp and secure it to the ring stand.
- Prepare 2 clean, small test tubes to collect the column fractions and a 100 mL beaker for waste. Label the TOP of the test tubes with your initials, the date and what fraction you will collect in that test tube (fraction 1 or fraction 2).
- Add ~1 mL of cyclohexane (measure using a transfer pipet) to your 50 mL beaker and gently mix to reconstitute (redissolve) your pigments.
- Keep your beaker covered as much as possible from now on to minimize evaporation.
- Transfer ~1/2 of the liquid in your beaker to a screw top vial labeled with your initials, the date, and your sample identity in cyclohexane (transfer the label from your beaker to the vial if possible, otherwise get a new label).
- Obtain 15 mL of ethyl acetate and 15 mL of cyclohexane in separate labeled beakers (keep these beakers covered as much as possible to minimize evaporation).
- Before elution, the column must be equilibrated (i.e., made to have similar solvent conditions as the mobile phase). To do this, place the waste beaker under the pipet column and elute 4-6 mL of cyclohexane through the column.
- Note: If air bubbles or cracks appear in the column, discard the column and repeat Step 1.
- Allow the solvent to drain naturally. Once the solvent has drained to just above the silica (just below the sand), pipet the rest of the pigment solution from the last week (no more than ~0.5 mL; add a little more cyclohexane to the vial if need be) evenly onto the column.
- Note: It is important here that while there is a little mobile phase left, there isn’t too much cyclohexane left on top of the column. If there is too much then this would dilute the pigment solution and “blur” the separation between the pigments.
- Allow the solution to adsorb onto the silica by letting it run into the column. Once the solution has adsorbed into the column (moved just below the sand) but before the silica is exposed to air, continue adding cyclohexane continuously. Observe and record the migration of the bands that appear. Continue collecting all clear liquids in a waste beaker.
- A colored band should appear and begin to travel down the column, possibly leaving a 2nd colored band near the top of the column. Continue adding cyclohexane until you finish collecting the first colored band in a clean test tube. Start collecting when the band is ~1 cm above the cotton plug and stop collecting ~1 mL after you can no longer see the band.
- Note that this band might look like it disappears as it nears the bottom of the column. This is just because the bottom of the column is narrower than the barrel of the column, so the pigment becomes less “concentrated”. This is nothing to worry about, just keep collecting.
- It is also possible that the only colored band you see stays near the top of the column. If this happens, try shining a bright flashlight on the column to see if that helps you see the band (take off your gloves to use the flashlight). If you still can’t see a band traveling down the column, stop after adding ~10 mL of cyclohexane and continue on to the next step.
- Once you have collected the first colored fraction, change the solvent by adding ethyl acetate instead of cyclohexane. Continue adding the solvent and collect the clear portion in the waste beaker.
- A 2nd colored band might start moving down the column. Collect this fraction in a different clean test tube the same way as you did for the first colored band. If you see a 3rd band (unlikely, but not impossible), collect it in a 3rd test tub
- If you don’t see a 2nd colored band traveling down the column, try the flashlight trick mentioned above, and if that doesn’t help, stop after adding ~10 mL of ethyl acetate.
- Note: It is possible that not all of the pigments will be removed from the column.
- Label a TLC plate the same way as last week except that the eluent will be 1:1 cyclohexane:ethyl acetate and instead of labeling the tic marks as 1, 2 and 3, label them as “C” (for “Crude”), F1 (for “Fraction 1”) and F2 (for “Fraction 2”). (Add a 4th lane labeled F3 if you were able to collect a 3rd fraction.)
- Spot each fraction on your TLC plate (you will need to decide if you need to single or double or triple spot these samples as it will depend on how concentrated they are).
- Clean your capillary tube between each fraction by sticking the tube into a small amount of pure ethyl acetate and pressing it into a Kim wipe until all of the liquid in the tube has been removed. Do this at least three times. (We didn’t need to do this last week because we weren’t spotting different samples, so there was no possibility of cross contamination the way there is this week.)
- Do a single spot of your crude mixture on the TLC plate.
- Run the TLC plate as before except use a 1:1 ethyl acetate:cyclohexane mixture as the eluent.
- Measure the absorption spectrum of each of the fractions using the Vernier GoDirect SpectroVis Plus with a small test tube (instead of a cuvette).
- Make sure the liquid level in the test tube is at or above the top of the cuvette holder of the SpectroVis. If it isn’t, add a small amount of cyclohexane or ethyl acetate (whichever solvent the fraction you’re measuring is dissolved in) until it is.
- Transfer your fractions into different screw top vials labeled (using the provided label) with your initials, the date, and your sample identity – fraction 1/fraction 2/fraction 3 in cyclohexane/ethyl acetate (depending on which solvent the fraction is dissolved in).
- Note that you should label the ethyl acetate fractions fraction 2/3 regardless of whether you were able to collect a sample using cyclohexane.
- Store all sample vials (crude sample and all of your fractions) in a small beaker (so they can’t tip over) in the tub in the fume hood to let the solvent evaporate. Do NOT put the caps on the vials, otherwise the solvent won’t fully evaporate. The solvent will evaporate away during this time leaving the pigment as residue. Once the solvent has evaporated, the lab staff will move your samples to the lab refrigerator to minimize any degradation of your sample. We will redissolve this residue in a different solvent next week.
Week 3/4: Ultraviolet and visible light spectroscopy (UV-vis)
You will analyze the crude mixture and any fractions you were able to collect UV-vis. Specifically, we will be using an Evolution 260 BIO UV-visible spectrophotometer from ThermoScientific to collect a spectrum from 700 nm to 260 nm in a FireFlySci 9pUV cuvette.
Your instructor will provide more information about the method closer to the time of the experiment.
- Dissolve each of your samples in ~1.2 mL of ethanol using a transfer pipet and cap it tightly to prevent evaporation.
- Be sure to use a new pipet for each sample so that you don’t contaminate the ethanol stock bottle with your pigments.
- Your instructor will do this step: Run a “blank” (cuvette with just solvent in it) to tell the spectrometer how much light of each wavelength reaches the detector if no sample molecules are present, but everything else is exactly the same.
- Transfer one of your samples to a clean FireFlySci 9pUV low flow cuvette (“low flow” actually means low volume, thus allowing us to use ~1 mL of sample instead of 3-5 mL of sample).
- Click on “measure”.
- Peak pick your spectrum to determine the exact wavelength at the maximum absorbances of your sample.
- Change the name of your spectrum to include your initials, the date and the identity of your sample (both the plant used and whether this is fraction 1, fraction 2 or the crude sample).
- Remove your cuvette from the spectrometer, dump out the liquid into the sink and rinse out the cuvette 3x with ~2 mL of ethanol each time.
- Repeat steps 3-7 with the rest of your samples.
- Make a PDF of all of your spectra by clicking on the “stop” button at the top right of the window, clicking on “report”, going to “Layout”, checking the “graph” box, clicking on the print button (looks like a tiny printer), then selecting “print to PDF” and email the PDF to yourself.
Sharing of Data
You will post images of your spectra along with your TLC images and information about the plant you used (species and overall appearance) via a shared Google Slides by midnight the day you complete your lab report.
Data Analysis
- Spectra of different plant pigments will be provided on Canvas. Compare these spectra to the spectra you collected. Can you identify these pigments?
- Compare your data to the data collected by the other groups with the same sample as you. Do they agree with each other?
- Compare your data to the data collected by the other groups with a different sample from you that had the same color as you (e.g. if you have a red pepper sample, compare it to a red tomato, but if you have an orange pepper sample, compare it to a carrot). Does your plant use the same pigment/mix of pigments to create the same color as the other plant?
Acknowledgment:
The extraction procedure is based on a protocol used previously for extracting pigments from spinach leaves for organic chemistry combined with an extraction procedure for extracting carotenoids from pineapple by Chutakool et al published in the Journal of Chemical Education in 2022.
- For further details, please read Hoefnagels, Biology: The Essentials, 4th Ed, Ch. 5.2 (Photosynthetic Pigments) or OpenStax Biology 2e, Ch. 8.2. ↵
