
2 Significant Figures
Purpose
- Measure different quantities and report the measurements using SI units.
- Familiarize yourself with the use of laboratory glassware and other measuring equipment.
- Gain a better understanding of significant figures and why they matter.
Expected Learning Outcomes
- Use various instruments to measure the volume/length/mass/absorbance/temperature of a liquid/solid sample. (LO 3)
- Determine how many significant figures a measurement has based on the instrument used to make the measurement and a set of measurements made with that instrument. (LO 3)
- Compare the precision associated with using different glassware for measuring volume. (LO 4)
- Determine the densities of solid samples. (LO 3, 4)
- Make solutions with different precision.
- Determine how many significant figures a calculated value should have. (LO 4)
Textbook Reference
Tro, Chemistry: Structures and Properties, 2nd Ed, Chapter E.2, E.3, E.4, E.5, E.7, E.8, E.9
Introduction
Significant Figures
One of the concepts that students struggle with the most in general chemistry is that of significant figures. As you learned in lecture, digits are significant if they have a basis in reality, which is to say if they tell us something about the thing being measured. When you measure something, the number will have 3 types of digits: known digits, estimated digits, and unknown digits. Known digits are digits that you are certain are correct. Estimated digits are digits you thinks are correct, but might be off by 1-2. Unknown digits are digits that our instrument doesn’t allow us to measure with any sort of certainty, which is to say that they don’t tell us anything about the thing being measured. Known digits and estimated digits are significant, unknown digits are not significant and thus usually aren’t reported.
If you want to measure your height, you’re probably going to measure it to the nearest inch (maybe the nearest half inch). Trying to measure it to the nearest tenth of an inch isn’t usually going to help you because how tall you are depends on your posture, the time of the day, and exactly where you measure the top of your head at, so your height down to the tenth of an inch is going to depend on exactly how you measure it. This means that if 3 different people measure your height down to the tenth of an inch, you’re going to get 3 different answers. But if 3 different people measure your height to the nearest inch, all 3 numbers are probably going to agree with each other.
Now, if you go to the doctor’s office to get your height measured, where they give you instructions on how to stand and use a more precise and accurate instrument being used by someone trained in using the instrument, the tenth of an inch digit starts to mean something, but if 3 different people in the doctor’s office measure your height down to the tenth of an inch, they will probably still disagree on the tenth of an inch digit, but it won’t be completely random the way it would be if a lay person measured your height. This is because the 1’s digit of your height is a known digit while the tenths digit is an estimated digit. Even the doctor’s office doesn’t bother reporting your height down to the hundredths of an inch because that’s an unknown digit. If they tried to give you your height to the hundredth of an inch, they would have to make up that last digit; it wouldn’t have any basis in reality.
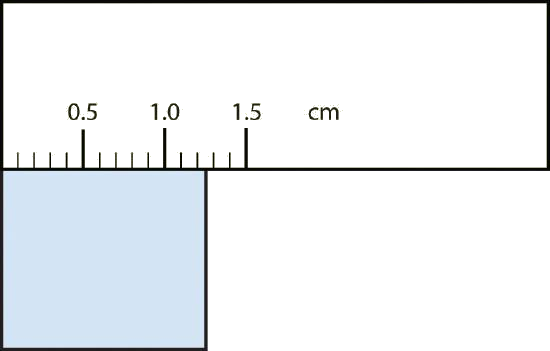
Because of this, it is necessary to express answers to reflect the degree to which you know a particular measurement. In Chemistry, the convention is that you know with certainty all digits that are marked on the measuring device (the graduations). In addition, you can estimate, with some certainty, the quantity to an additional decimal place. All of these are considered significant figures. What this means is that in chemistry, 11 mL, 11.0 mL and 11.00 mL are all different volumes that convey different information. 11 mL means the volume is within a few milliliters of 11 mL. It may or may not actually be 11 mL, but it’s definitely more than 6 mL and definitely less than 16 mL. Unless otherwise stated, it is assumed that the variance in the last digit is ±1, thus 11 mL implies the true value of the volume is 11 ± 1 mL, which is to say that the true value is somewhere between 10 and 12 mL. On the other hand, 11.0 mL means that this volume is pretty close to being exactly 11 milliliters. It might be a few tenths of a milliliter off, but it’s pretty darn close, typically somewhere between 10.9 mL and 11.1 mL. 11.00 mL means that for all practical purposes, this volume is exactly 11 milliliters. It might be off by a few hundreths of a milliliter, but for the purposes of this class, we can consider it to be exactly 11 milliliters.
Examples
Measuring Volumes: Dealing with the Meniscus
For liquids in any container, there will typically be a curved surface rather than a flat surface.[1] The meniscus needs to be read such that the the level of liquid read is the bottom of the meniscus (the curved surface). In the image below, the meniscus can be seen as a light blue curved line between the 38 mL and 39 mL graduations on the graduated cylinder.
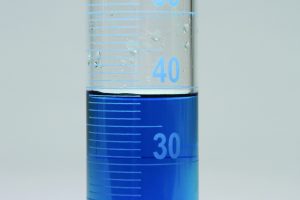
In the image above, I would put the bottom of the meniscus at roughly half-way between the 38 and 39 mL graduations (see here for a larger version of the image), but I think it’s slightly closer to the 39 mL graduation, so I would call this 38.6 mL. I only report to the tenth of a mL because the graduations on this graduated cylinder are every 1 mL, thus the 10’s and 1’s digit in this measurement are certain, the tenths digit is estimated, and all the digits beyond the tenths digit are unknown and thus do not need to be reported since they aren’t significant.
Accuracy vs Precision
We use accuracy and precision to characterize the quality of measurements. It is important to realize that it is impossible to measure anything completely accurately or precisely; however, especially in analytical chemistry, it is very important that we try our best to be as accurate and precise as possible.
Accuracy
Accuracy refers to how close measurements compare to the true (accepted) value. A measurement is generally considered accurate if the true value of the thing being measured is within the given tolerance of the instrument being used to make the measurement. Remember that unless otherwise stated, the tolerance of a measurement is assumed to be ±1 in the last significant digit. This means that if the volume of the blue water in the graduated cylinder above is actually 38.48 mL, then my reading is accurate because 38.48 mL rounded to 3 sig figs is 38.5 mL which is within 1 tenth of a mL of my measurement of 38.6 mL.
Precision
Precision refers to how close a set of measured results are to each other, which is to say how replicable the measurement is. If you and/or other people can consistently measure the same value for the same object, your measurements are precise. Of course, as you learned above, how replicable a measurement is depends on how many digits you report. A more precise instrument allows you to report more digits consistently between people than a less precise instrument. This means that the precision of a measurement can be determined by looking at the spread of values for a specific measurement OR by looking at how many significant figures a measurement has since a digit is only significant if it doesn’t vary much between measurements. This is why understanding how to determine how many significant figures your measurement should have is so important, because it allows you to determine the precision of your measurements without needing to measure it multiple times.
When lab equipment is working properly, accuracy and precision go hand in hand: the more accurate an instrument is, the more precise it is too. There’s no point in trying to make a more precise measurement if that measurement isn’t accurate to that level of precision. There’s also no point in trying to make an instrument that can be more accurate if you don’t also give yourself a way to measure whatever you’re trying to measure more consistently by increasing the precision of the instrument. For example, if you want to use a fluorescence microscope to see where a protein (~10 nm in size) is in a cell, you had better make sure that the table your microscope is on isn’t vibrating at all, because if it is vibrating back and forth even 1 μm, it doesn’t matter how much magnification your microscope gives you, you won’t be able to pinpoint exactly where that organelle is because it’s moving, thus every time you take a picture, it’s in a different spot. More magnification will give you more potential for accuracy, but without also decreasing the vibrations of the table, you won’t get a corresponding increase in precision that will allow you to take advantage of that potential accuracy.
However, sometimes lab equipment doesn’t work properly. Maybe it’s not calibrated correctly or you aren’t using it properly (maybe instead of reading the bottom of the meniscus in a graduated cylinder, you consistently read the volume from the top of the meniscus). When this happens, the accuracy of the measurement suffers even though the consistency doesn’t. If a balance isn’t calibrated properly, it will tell you the wrong answer every single time you use it (low accuracy) even if it always gives the same answer when measuring the same object (high precision). This is why it is so important that you don’t move the balances in the lab; doing so can change the calibration and give you inaccurate results even though the number of significant figures it gives you stays the same.
The difference between accuracy and precision can also be seen in statements of fact. The statement “I live in the Milky Way galaxy” is accurate, but it’s so imprecise as to be useless. The statement “I live at 6902 Schroeder Road, Madison, Wisconsin, the United States of America, North America, Earth, the solar system, in the Tintagel arm of the Milky Way galaxy” is a much more precise statement, but it’s inaccurate; I live in Richmond. Because this statement is inaccurate, there’s no need for my statement to be that precise, but that doesn’t mean that it can’t be precise.
While you will often determine the precision of a measurement by using the rules above to determine how many significant figures an instrument (especially a piece of glassware) will give you, today we’re going to focus on proving experimentally that these rules actually give the correct number of significant figures by having the entire class make the same set of measurements and seeing which digits vary between different people.
Density
The density of an object is based on both its mass and its volume. Specifically, density = mass/volume. In most cases, the density of liquids is measured in grams per milliliter (g/mL). In this case, the mass is measured in grams and the volume is measured in milliliters. An identical unit (more commonly used for solids) is grams per cubic centimeter. For gases, grams per liter (g/L) is more commonly used.
Because density depends on 2 measurements, the precision of the measurement of the density of an object is based on the precision of both the mass measurement and the volume measurement, which is to say the number of significant figures the density of an object has is dependent on both the number of significant figures the mass measurement has AND the the number of significant figures the volume measurement has. Specifically, because you divide the mass by the volume, the number of significant figures the density has is determined by whichever measurement has fewer significant figures (remember from lecture that if you add/subtract 2 measurements, the number of significant figures in the answer is based on which digit is least precise in the 2 measurements, not the number of significant figures in the measurements like for multiplication/division).
We are going to prove this experimentally by measuring the mass and volume of an object with a known density using different instruments of differing precision and then calculating the density of the object so that we can see which digits are accurate using each combination of measurements.
Examples
A cube has a volume of 14.2 mL and a mass of 62.0 g. Its density is therefore 62.0 g/14.2 mL = 4.37 g/mL.
Procedures
- This experiment is split up into 2 parts.
- In the first part, your instructor will split your class up into 4 groups and each group will rotate around 4 stations and make the assigned measurements individually at each station.
- It is important that you do NOT talk to the other people in your group during this part of the experiment as the entire point is to collect data independently and then check your data against everyone else’s.
- In the second part of this experiment, you will work with your partner to experimentally determine the density of an object and make several solutions of the same concentration, but with different levels of precision.
- You must ensure that (for this and all future experiments) all results are reported with correct units.
- Refer to the section Using Standard Laboratory Equipment for guidance on using the balance and volumetric glassware.
- It is critical that you do not move the balance during the experiment.
- When reading any scale, you should ensure that your eyes are directly parallel to the markings on the scale. Otherwise, you will encounter parallax error as explained in Using Standard Laboratory Equipment.
- When estimating a digit, most people have the tendency to guess to the nearest 5. Don’t do this as it makes your estimation less precise. In other words, the last digit of your estimates should rarely be 0 or 5 (in fact, 0 should be the last digit of your estimate only 10% of the time).
Part 1: Determining Significant Figures Experimentally
You learned above and in lecture how to determine how many significant figures a measurement should have based on the graduations (markings) the tool used to make the measurement has. Now we’re going to test this experimentally to get a better sense of what significant figures really are and see why we determine the number of significant figures this way. To do so, everyone in the class will measure the volume/mass/length/absorbance/temperature of an object using the same tool and then we will compare everyone’s measurements to see how well you agree with each other based on what tool you are using to make the measurement. To make obtaining these measurements more efficient, there will be 4 stations setup each with a different set of objects for you to measure. Your instructor will split up your class into 4 groups and each group will spend ~5 minutes at a station before rotating to the next station. Once you have visited each station and made all your measurements, you will need to go to the shared Google Sheet (see Canvas for the link) and enter all of your measurements. Please do NOT speak with your groupmates during this part of the experiment as it is important that the measurements you make are completely your own and not influenced by what your partners think the correct measurement is.
Station 1 – Volume of Water
At this station, you will be measuring the volume of 6 different samples of water to the thousandth of a mL using 3 different graduated cylinders and 3 different beakers: a 10 mL graduated cylinder, a 100 mL graduated cylinder, a 500 mL graduated cylinder, a 10 mL beaker, a 50 mL beaker, and a 100 mL beaker. The water samples have already been added to the glassware, so please do not touch the samples, just read the volumes. Note cards will be provided if you wish to have a blank/lined white background behind the glassware to make determining where the bottom of the meniscus is for each sample.
Put the following data table in your lab notebook before class:
| glassware | volume (mL) | graduations/markings (mL) |
| 10 mL graduated cylinder | ||
| 100 mL graduated cylinder | ||
| 500 mL graduated cylinder | ||
| 10 mL beaker | ||
| 50 mL beaker | ||
| 100 mL beaker |
For each sample, use the following procedure to estimate the volume of water in the glassware:
- Making sure your eyes are at the same level as the surface of the water in the glassware, determine the volume of the water to the nearest thousandth of a milliliter.
- Based on what we learned above and in lecture, the thousandths digit should not be significant for any of these pieces of glassware, but since the point of this experiment is to determine how many significant figures each instrument truly has, it’s important to go beyond what we expect to be significant so that we can see experimentally if the last digit we expect to be significant is actually the last significant digit or not.
- You might find it easier to determine where the bottom of the meniscus is if you put a note card behind the glassware so that you have a blank white background. Alternatively, you might find it easier to read the volume of the bottom of the meniscus if you use the lined side of the note card and make it so that one of the lines of the card is at the same level as the bottom of the meniscus.
- Write down your best estimate of the volume of the water in the glassware to the nearest thousandth of milliliter in the appropriate cell of station 1 data table in your lab notebook.
- Note that if you specify the units at the top of a column in your table (mL in this case), you don’t need to add the units to the numbers in that column since it is understood that all the numbers in that column have the units specified at the top. But if you don’t specify the units at the top of the column, then you need to include the units with every number you put in that column. This is usually done if you want to use different units for different cells in your column (e.g., mL in one cell, but g in another).
- You should also make note of the graduations used on each piece of glassware (e.g., every mL, every 10 mLs, every tenth of a mL, etc.)
Station 2 – Mass of Objects
At this station, you will be measuring the mass of 3 different objects using your hands and 2 different types of digital scales: a “plug-in” digital scale found at the station, and a lab digital scale found in the front right corner of the lab. Do not move the lab digital scales! The objects you are measuring the mass of will vary from section to section, so make sure you provide a basic description of each object in your lab notebook.
Put the following data table in your lab notebook before class:
| Instrument | mass (g) | object |
| hands | ||
| “plug-in” scale | ||
| lab scale |
To estimate the mass of an object with your hands, you will need to compare the object with those of known masses. Fortunately, we have calibration weights that are used to calibrate balances and make sure they are still accurate. You will need to put the object to be measured in one hand and then put one calibration weight in the other. If the object feels heavier than the calibration weight, then replace it with the next heaviest calibration weight. Continue this until you believe you know which 2 calibration weights the mass of the object is between. Once you have done this, estimate the mass of the object to the nearest tenth of a gram.
To measure the mass of an object with a digital scale, press the “zero”/”tare”/”on” button to zero the scale if need be (i.e., if the scale doesn’t read exactly 0). Place the object to be measured in the center of the plate of the digital scale and wait for the mass to stabilize. Once the mass no longer changes, record the mass in your lab notebook to as many digits as the scale provides.
- With very sensitive digital scales like the lab digital scales, it’s possible that the mass will never stabilize. This is because digital scales can drift slightly over time (hence the need to constantly tare them) and because they are sensitive enough to sometimes be affected by air currents in the room. If the problem is air currents, the last digit will be bouncing up and down randomly and you will have to estimate the “average” for that digit. If the problem is drift, the last digit will slowly increase/decrease over time and you will need to take the object off, tare the scale again and measure the mass of the object as quickly as possible.
Station 3 – Length of Objects
At this station, you will be measuring the length of 4 different objects to the tenth of a mm using your eyes, a printed ruler, a commercial ruler, and calipers. The objects you are measuring the length of will vary from section to section, so make sure you provide a basic description of each object in your lab notebook. Estimate the length of each object to the tenth of a mm.
Put the following data table in your lab notebook before class:
| Instrument | length | object |
| eyeball | ||
| printed ruler | ||
| commercial ruler | ||
| calipers |
Because you probably aren’t used to estimating the length of things in mm, when you eyeball the length of the object, you will need to record the length in your lab notebook in inches (estimate to the hundredth of an inch) and then covert it to mm using the conversion factor 1 inch = 25.4 mm (exactly).
To measure the length of an object with calipers, open the calipers until the tines are slightly larger than the object, insert the object between the tines and close the tines until they are pressed against the object.
Station 4 – Other Measurements
At this station, you will be making an eclectic mixture of measurements that didn’t fit well into any of the other stations. You will measure the volume of water in a buret to the nearest hundreth of a mL using the same procedure indicated in station 1, except that the graduations (markings) on a buret go in the opposite direction as a graduated cylinder/buret, meaning that the 0 mL mark is at the top instead of the bottom. This means that if the water level is just below the 10 mL mark, then your estimate of the volume should be slightly above 10 mL, not slightly below 10 mL like with a graduated cylinder. You will measure the absorbance of a dilute solution of blue food coloring using a SpectroVis using the procedure below. You will be estimating how many beads there are in a jar to the nearest bead and the percentage of those beads that are red to the nearest tenth of a percent. You will be measuring the temperature of a beaker of water to the nearest tenth of a degree using the procedure below. And you will measure the conductivity of a 7.00 mM NaCl solution using the procedure below.
Put the following data table in your lab notebook before class:
| Instrument/object | measurement |
| Buret | |
| SpectroVis | |
| Beads | |
| Thermometer | |
| Conductivity Meter |
SpectroVis instructions:
Before you get to lab, you will need to have installed on your device (tablet/cellphone) the Vernier Spectral Analysis software. Either obtain it from the link or go to your device’s App Store. Bluetooth must also be enabled on your device.
If the SpectroVis isn’t on, press the power button on the GoDirect SpectroVis Plus device. The Bluetooth LED will blink. Wait 5 minutes for the spectrometer to warm up.
- Launch the Vernier Spectral Analysis app. Keeping the device close to your device, tap on Connect a Spectrometer. Select your spectrometer (if you see more than one device, try and match the device ID, found near the barcode on the label).
- Choose “Calibrate”.
- Place the cuvette with water (“A”) into the sample holder of the SpectroVis (this is the square hole in the corner of the instrument).
- Make sure to align the clear sides to the cuvette with the white arrow and the white light bulb symbol by putting the arrow at the top of the cuvette next to the white arrow next to the sample holder.
- Once the calibration is complete, remove the cuvette with water and place it back into the cuvette arrow, then place the cuvette with the blue food coloring (“B”) in the SpectroVis (aligning the arrows again) and measure the absorbance at 617 nm. Write this absorbance in your lab notebook. Use “AU” for the units (which stands for Absorbance Units or Arbitrary Units depending on whom you ask).
- Remove the cuvette from the SpectroVis and replace it in the cuvette holder.
Thermometer instructions:
- Hold the thermometer from the top and place it in the water such that the thermometer is perfectly straight and the bulb is ~1 cm from the bottom for at least 1 minute.
- When the liquid in the thermometer stops moving, lower your eyes to the level of the top of the liquid in the thermometer and read it the same way you would read a graduated cylinder (although there won’t be a visible meniscus) to the nearest tenth of a degree Celsius.
Conductivity Meter instructions:
- Remove the outer plastic casing from the conductivity meter so that the metal probe is bare.
- Press the “On” button to turn on the conductivity meter.
- Place the bare metal probe of the conductivity meter into the test tube labeled “7.00 mM NaCl” such that the top of the liquid in the test tube is above the “MIN” marking on the probe and below the “MAX” marking.
- Once the reading stabilizes, read the conductivity off of the digital display on the conductivity meter and record it in your lab notebook.
- The nominal concentration units used by these conductivity meters are “TDS” (Total Dissolved Solids), but this is actually the same as “ppm” (parts per million), which is a more common unit for chemists to use.
- X parts per million means that if you divide the solution into 1 million parts, then X parts would be the solute of interest. This is very similar to “percent”, but percent is parts per hundred.
- ppm is also the same as “mg of solute/kg of solution”
- The nominal concentration units used by these conductivity meters are “TDS” (Total Dissolved Solids), but this is actually the same as “ppm” (parts per million), which is a more common unit for chemists to use.
- Remove the conductivity meter from the solution and thoroughly rinse off the probe with a distilled water squirt bottle into the sink.
- BLOT the probe dry by dabbing at the water droplets with a Kim Wipe.
- Do NOT wipe it dry as this can cause a build-up of static electricity and damage the electronics.
- Put the outer plastic casing back on the probe and turn the conductivity meter off before giving it to the next person.
Once you have finished recording data at all 4 stations, put your data into the shared Google Sheets file for your section. You can find the link on Canvas. Make sure you are signed into your IU Google account, otherwise you won’t be able to access the shared Google Sheets file. Each station has its own sheet, which can be accessed by clicking on the appropriate tab at the bottom of the screen. Each student has been assigned a specific row to enter their data into. You can find out which row is yours by looking at the names in the far left column. The top row tells you which data to put into which column. Note that you should only report the length of the object in mm for station 3, not inches.
Once everyone has entered their data, your instructor will lead a discussion about how to use the data to determine how many significant figures each measurement has. To do this, think about which digits in each set of data are known (the same between all measurements), estimated (within 5 between all measurements), and unknown (completely random between all measurements). For analog instruments (where you have to decide what to put for each digit), the known digits are obvious because of the graduations (markings) on the instrument. The estimated digits require you to make a decision and thus there is some skill involved in estimating the digit accurately. For unknown digits, you completely guess what it is and thus you get a random number that has no basis in reality, regardless of your skill.
Part 2 – Measuring Density and Making Solutions
In this part of the experiment, you will work in pairs to measure the density of an object to the correct number of significant figures and make 2 sodium chloride solutions of the same concentration, but measuring out the salt and water using different levels of precision to see how that affect the precision of the concentration of the resulting solution.
Note that the order you do the following parts doesn’t matter. It is recommended that half the groups measure the density first and half the groups make the solutions first so that fewer people are trying to use the lab balances at the same time.
Measuring Density
To measure the density of an object, we need to measure first the mass of the object and then the volume of the object (mass needs to be measured first so that you don’t measure the mass of any residual water from measuring its volume). To measure the mass, first use a “plug-in” balance, then use one of the lab balances using the procedure specified above. Record both masses in your lab notebook to the correct number of significant figures using the table below.
Before making any measurements, be sure to observe the object and describe it in your lab notebook.
To determine the volume of the object, we will measure the amount of water the object displaces using a 100 mL beaker and 100 mL graduated cylinder using this procedure:
- add ~70 mL to the beaker so that when you add the object, it will be completely covered by the water
- measure the volume of the water before adding the object to the beaker using the procedure you used in part 1 above except measure to the correct number of significant figures and record it in the table in your lab notebook
- carefully add the object to the beaker so that there is no splashing by tilting the beaker and sliding the object down the side of the beaker until the object is completely submerged in the water (it is probable that you will need to knock over the object so that it isn’t upright for it to be completely submerged)
- measure the volume of the water again and record it in the table in your lab notebook
- thoroughly dry off the object so there is no water present on it, then repeat this procedure using the graduated cylinder
| volume (mL) | |||||
| mass (g) | initial volume | final volume | volume of object | ||
| plug-in balance | beaker | ||||
| lab balance | graduated cylinder | ||||
Making Solutions
You’re now going to make a 7 mM and 7.0 mM NaCl solutions and measure their conductivity (which is proportional to their concentration) to see experimentally what the difference is between two numbers that only differ in how many significant figures they have. Review the “Taking Care of Electronic Balances” section of the “Using Standard Lab Equipment” page of this lab manual before continuing. Record the masses, volumes and conductivities of each solution in your lab notebook to the correct number of significant figures using the table below.
Solution 1: 7 mM NaCl
- Label a 150 mL beaker with “solution 1: 7 mM NaCl” using a piece of label tape. Include your initials and the date on your label.
- Add a piece of weigh paper to a lab balance and tare it.
- Weigh out 0.035 g NaCl onto the weigh paper and record the exact mass in your lab notebook.
- It is generally better to pour out of stock bottles than to stick something like a scoop/spatula into them, but this is also acceptable.
- If you accidentally weigh out more than 0.035 g NaCl, remove the weigh paper with the NaCl from the balance, add a new piece of weigh paper, tare it, then transfer most of NaCl from the first weigh paper onto the 2nd weigh paper until the balance reads 0.035 g. Do NOT put the excess back into the stock bottle! Once a chemical is out of a stock bottle, you should assume it is contaminated and it is better to dispose of a little excess chemical than contaminate the entire stock bottle and thus need to dispose of the entire stock bottle. If you do have any excess NaCl, you can either give it to another group or throw it away in the normal trash (NaCl is table salt).
- Transfer the 0.035 g of NaCl to the labeled 150 mL beaker (bring the beaker to the balance since you are much more likely to spill powders that are on a piece of weigh paper than powders that are in a beaker).
- Add distilled water to the beaker until the total volume is as close to 85.55784 mL as you can get.
- Record the actual final volume to the correct number of significant figures in your lab notebook.
- Add a stir bar to the beaker (angle the beaker and slide the stir bar down the side to minimize splashing), put the stir bar on a stir plate (found in the cabinet under the sink), and gently stir the solution until all the solid has dissolved.
- While waiting for the solid to dissolve, move on to making the next solution.
Solution 2: 7.0 mM NaCl
- Label a new 150 mL beaker with “solution 2: 7.0 mM NaCl” using a piece of label tape. Include your initials and the date on your label.
- Weigh out 0.035 g NaCl onto a weigh paper and record the exact mass in your lab notebook using the same procedure as for solution 1.
- Transfer the 0.035 g of NaCl to a 100 mL graduated cylinder (bring the graduated cylinder to the balance).
- Add distilled water to the graduated cylinder until the total volume is as close to 85.55784 mL as you can get.
- Record the actual final volume to the correct number of significant figures in your lab notebook.
- Pour the solution back and forth between the 150 mL beaker labeled “solution 2” and the 100 mL graduated cylinder until all the solid has dissolved.
- An alternative way to dissolve the solid is to stretch a piece of parafilm over the top of the graduated cylinder, then put your hand over the top of the graduated cylinder and invert it several times until the solid has dissolved, then remove the parafilm and pour it into the 150 mL beaker labeled “solution 2”. If you wish to use this method, your instructor will show you the proper method.
Once the solids are completely dissolved in both solutions, pour some of each solution into small, labeled test tubes until they are half to two thirds full. Place these test tubes in a test tube rack (found beneath the sink) and measure the conductivity of each solution and add them to your lab notebook using a conductivity meter as explained in station 4 above. Be sure to rinse the meter and blot it dry between measuring solution 1 and solution 2, but you don’t need to turn off the conductivity meter or put the plastic casing back on until you have measured the conductivity of both solutions.
| mass of NaCl (g) | total volume of solution (mL) | Conductivity (ppm) | |
| Solution 1: 7 mM NaCl | |||
| Solution 2: 7.0 mM NaCl |
Once you have collected your data on the solutions, dispose of your NaCl solutions down the drain and rinse your glassware thoroughly with tap water and then distilled water and put back in your drawer (there is no need to wash the glassware with soap this time). Then put your data into the appropriate sheet of the same shared Google Sheet as you used in part 1 so that everyone can see the conductivity of the 7 mM and 7.0 mM NaCl solutions that each group made. There is no need to share the data you collected for determining the density of your object above.
