
49 Conduction system of the heart and the ECG
Learning Objectives
After studying this section, you should be able to-
- List the parts of the electrical conduction system of the heart in the correct sequence for one contraction and explain how the electrical conduction system functions.
- Explain why the SA node normally paces the heart.
- Explain how the cardiac conduction system produces coordinated heart chamber contractions.
- Name the waveforms in a normal electrocardiogram (ECG or EKG) and explain the electrical events represented by each waveform.
Conduction System
The pattern of drift followed by depolarization and repolarization described previously, are seen in the sinoatrial (SA) node and a few other conductive cells in the heart. Since the SA node is the pacemaker, it reaches threshold faster than any other component of the conduction system. It will initiate the impulses spreading to the other conducting cells. The SA node, without nervous or endocrine control, would initiate a heart impulse approximately 80–100 times per minute. Although each component of the conduction system can generate its own impulse, the rate progressively slows as you proceed from the SA node to the Purkinje fibers. Without the SA node, the atrioventricular (AV) node would generate a heart rate of 40–60 beats per minute. If the AV node were blocked, the atrioventricular bundle would fire at a rate of approximately 30–40 impulses per minute. The bundle branches would have an inherent rate of 20–30 impulses per minute, and the Purkinje fibers would fire at 15–20 impulses per minute. While a few exceptionally trained aerobic athletes demonstrate resting heart rates in the range of 30–40 beats per minute, for most individuals, rates lower than 60 beats per minute would indicate a condition called bradycardia. Depending upon the specific individual, as rates fall much below this level, the heart would be unable to maintain adequate flow of blood to vital tissues, initially resulting in decreasing loss of function across the systems, unconsciousness, and ultimately death.
The SA node’s rapid firing rate sets the pace for the heart, initiating impulses that spread through the atria, causing atrial contraction. This impulse is delayed at the AV node, allowing the ventricles to fill with blood. After this brief delay, the impulse then travels through the AV bundle, bundle branches, and Purkinje fibers, coordinating the contraction of the ventricles. Since the SA node reaches threshold faster than any other part of the conduction system due to its inherent pacemaker activity, it is the true pacemaker of the heart, and ultimately sets the pace that determines heart rate.
The SA node has two primary functions. It sends signals throughout the atria that cause atrial contraction, as well as sending it to the AV node. The AV node then holds on to the impulse, before sending it along the bundle branches and Purkinje fibers which result in ventricular contraction. These signals travel quickly through the bundle branches and Purkinje fibers which allow a synchronized ventricular contraction to occur.
Electrocardiogram
By careful placement of surface electrodes on the body, it is possible to record the complex, composite electrical signal of the heart. This tracing of the electrical signal is the electrocardiogram (ECG), also commonly abbreviated EKG (K coming kardiology, from the German term for cardiology). Careful analysis of the ECG reveals a detailed picture of both normal and abnormal heart function and is an indispensable clinical diagnostic tool. The standard electrocardiograph uses 3, 5, or 12 leads. The greater the number of leads used, the more information the ECG provides. The term “lead” may be used to refer to the cable from the electrode to the electrical recorder, but it typically describes the voltage difference between two electrodes (bipolar leads).
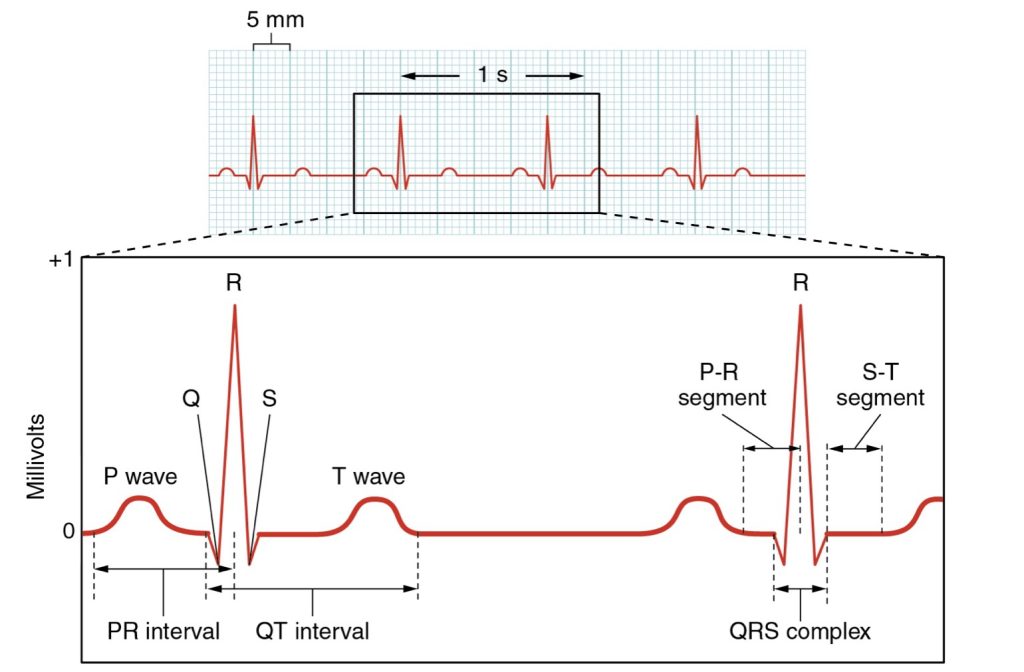
A normal ECG tracing is presented in Figure 49.1. Each component, segment, and interval is labeled and corresponds to important electrical events, demonstrating the relationship between these events and contraction in the heart.
There are five prominent components (points) on the ECG: the P wave, the QRS complex, and the T wave. The small P-wave represents the depolarization of the atria. The atria begin contracting approximately 25 ms after the start of the P wave. The large QRS complex represents the depolarization of the ventricles, which requires a much stronger electrical signal because of the larger size of the ventricular cardiac muscle. The ventricles begin to contract as the QRS reaches the peak of the R wave. Lastly, the T-wave represents the repolarization of the ventricles. The repolarization of the atria occurs during the QRS complex, which masks it on an ECG.
The major segments and intervals of an ECG tracing are indicated in Figure 49.1. Segments are defined as the regions between two waves. Intervals include one segment plus one or more waves. For example, the PR segment begins at the end of the P wave and ends at the beginning of the QRS complex. The PR interval starts at the beginning of the P wave and ends with the beginning of the QRS complex. The PR interval is more clinically relevant, as it measures the duration from the beginning of atrial depolarization (the P wave) to the initiation of the QRS complex. Since the Q wave may be difficult to view in some tracings, the measurement is often extended to the R that is more easily visible. Should there be a delay in passage of the impulse from the SA node to the AV node, it would be visible in the PR interval.
Adapted from Anatomy & Physiology by Lindsay M. Biga et al, shared under a Creative Commons Attribution-ShareAlike 4.0 International License, chapter 19
natural pacemaker of the heart
the node that allows for electrical connection between the atria and ventricles of the heart
a slower than normal heart rate, typically defined as a heart rate lower than 60 beats per minute
a recording of the heart's electrical activity
the portion of an ECG representing atrial depolarization, and therefore atrial contraction
the portion of the ECG representing ventricular depolarization and atrial repolarization
the portion of an ECG representing ventricular repolarization
the regions on an ECG between two waves
the regions of an ECG that represents the duration of time between a segment and a wave
the portion of an ECG measuring the duration of time from the beginning of atrial depolarization to ventricular depolarization (and atrial repolarization); the measurement of the duration of time that a signal takes to pass between the SA and AV nodes
