
38 Markov Chain
A Markov chain is a way of modeling long-term probabilistic behavior [8]. The Markov process consists of a finite number of disjoint states in which every individual of the system is located [8]. With each step of the process, each individual may either stay in the state they are in or change to another state [8]. Additionally, there are probabilities associated with each state [8]. One probability associated with a specific state gives the likelihood that an individual in that state will remain in that state in the next step. The other probabilities associated with that state give the likelihoods that an individual in that state will transition to one of the other states in the next step.
The Markov chain process is easier to understand when we have a concrete example with some visual aids rather than just a general description. So to help with understanding, we will now go through a problem I completed as homework for Mathematical Models/Applications II that comes from Giordano et al. [8].
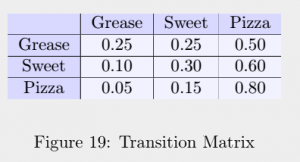
Consider a model for the long-term dining behavior of the students at College USA. The students have a choice of eating at Grease Dining Hall, eating at Sweet Dining Hall, or ordering pizza. The following table gives the transition percentages based on a student survey. Determine the long-term percentage of students choosing each option.
Solution
The table above is known as the transition matrix. Each number is the percentage of students who will transition from the present state (row) to the next state (column). For example, in any given day, 30% of students who eat at Sweet Dining Hall will eat there again the next day, and 60% will order pizza the next day.
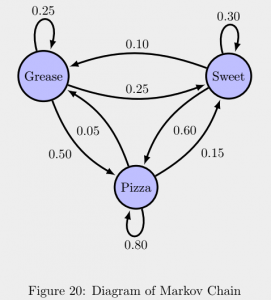
The following is a diagram to help picture what is happening. This diagram is one I created with help from Thornton [25].
Let  ,
,  , and
, and  be the percentages of students who eat at Grease Dining Hall, eat at Sweet Dining Hall, and order pizza on day
  respectively. Using either the transition matrix or the diagram, we can formulate the following equations:

Regardless of what values we choose for  ,
,  , and
, and  , the percentages of students eating at Grease, eating at Sweet, and ordering pizza will remain the same after some days. Using our equations, we have the following table:
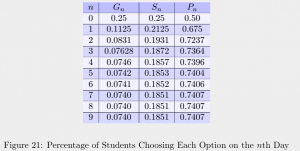
We can see from our table that the percentages remain consistent starting on the seventh day. Thus, the long-term percentages are:

Our next topic is on how to choose the best option from a list of choices by modeling the information given with decision trees and using probability to calculate the expected value of each option.